Asian vs Immigrants from Western Europe In Labor Force | Age 25-29
COMPARE
Asian
Immigrants from Western Europe
In Labor Force | Age 25-29
In Labor Force | Age 25-29 Comparison
Asians
Immigrants from Western Europe
84.8%
IN LABOR FORCE | AGE 25-29
77.7/ 100
METRIC RATING
133rd/ 347
METRIC RANK
84.7%
IN LABOR FORCE | AGE 25-29
50.4/ 100
METRIC RATING
172nd/ 347
METRIC RANK
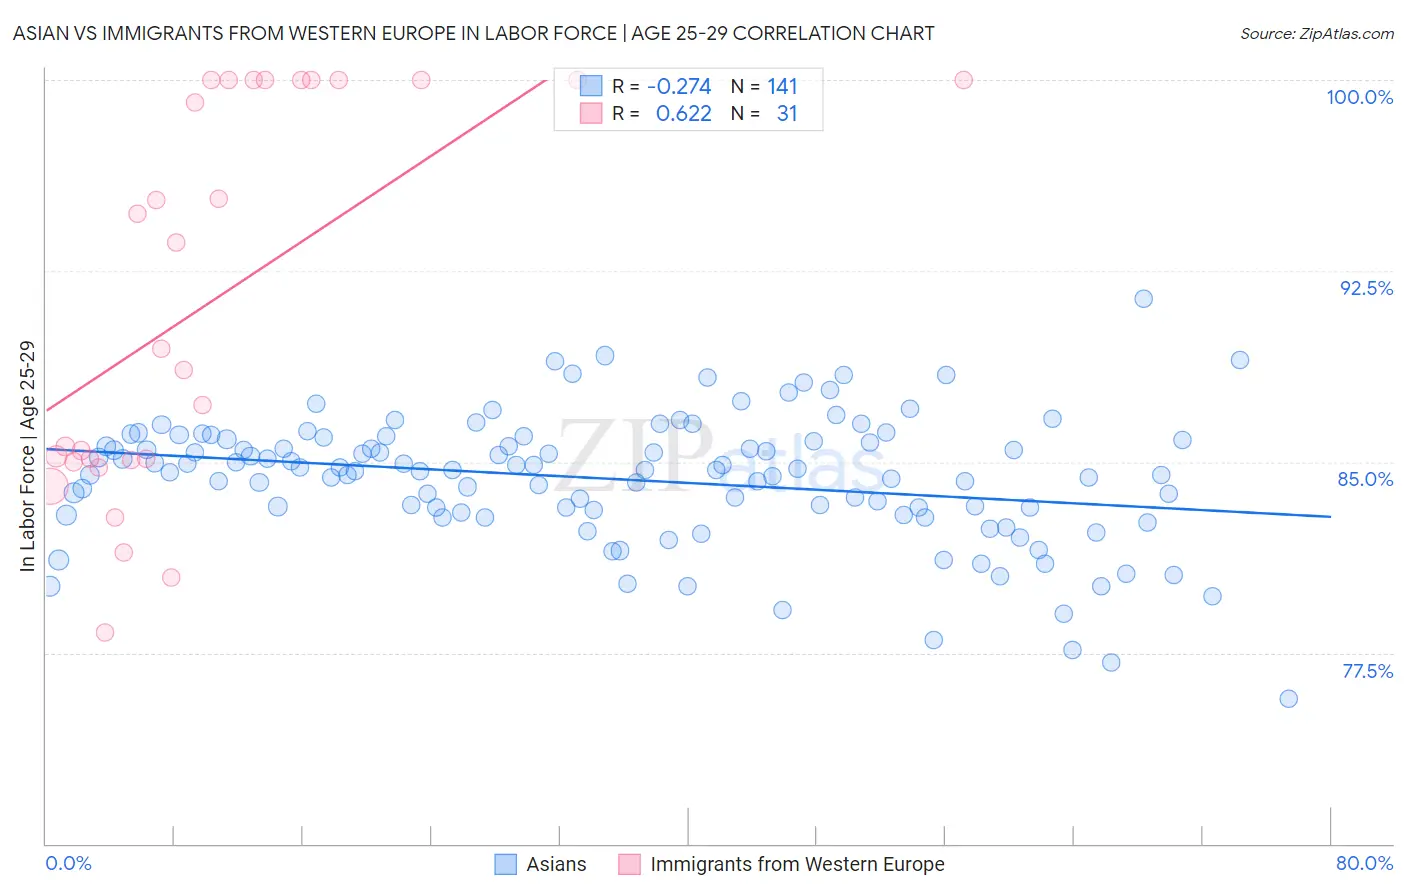
Asian vs Immigrants from Western Europe In Labor Force | Age 25-29 Correlation Chart
The statistical analysis conducted on geographies consisting of 550,144,058 people shows a weak negative correlation between the proportion of Asians and labor force participation rate among population between the ages 25 and 29 in the United States with a correlation coefficient (R) of -0.274 and weighted average of 84.8%. Similarly, the statistical analysis conducted on geographies consisting of 493,653,043 people shows a significant positive correlation between the proportion of Immigrants from Western Europe and labor force participation rate among population between the ages 25 and 29 in the United States with a correlation coefficient (R) of 0.622 and weighted average of 84.7%, a difference of 0.23%.
In Labor Force | Age 25-29 Correlation Summary
| Measurement | Asian | Immigrants from Western Europe |
| Minimum | 75.7% | 78.3% |
| Maximum | 91.4% | 100.0% |
| Range | 15.7% | 21.7% |
| Mean | 84.3% | 91.4% |
| Median | 84.7% | 89.5% |
| Interquartile 25% (IQ1) | 83.0% | 85.1% |
| Interquartile 75% (IQ3) | 85.9% | 100.0% |
| Interquartile Range (IQR) | 2.8% | 14.9% |
| Standard Deviation (Sample) | 2.5% | 7.5% |
| Standard Deviation (Population) | 2.5% | 7.4% |
Similar Demographics by In Labor Force | Age 25-29
Demographics Similar to Asians by In Labor Force | Age 25-29
In terms of in labor force | age 25-29, the demographic groups most similar to Asians are Iranian (84.8%, a difference of 0.0%), Romanian (84.8%, a difference of 0.0%), Syrian (84.8%, a difference of 0.010%), Immigrants from Hungary (84.8%, a difference of 0.010%), and Bhutanese (84.8%, a difference of 0.020%).
| Demographics | Rating | Rank | In Labor Force | Age 25-29 |
| Immigrants | Singapore | 84.4 /100 | #126 | Excellent 84.9% |
| Immigrants | Uruguay | 84.0 /100 | #127 | Excellent 84.9% |
| Australians | 83.6 /100 | #128 | Excellent 84.9% |
| Immigrants | Russia | 81.6 /100 | #129 | Excellent 84.9% |
| Northern Europeans | 81.3 /100 | #130 | Excellent 84.9% |
| Iranians | 78.1 /100 | #131 | Good 84.8% |
| Romanians | 77.7 /100 | #132 | Good 84.8% |
| Asians | 77.7 /100 | #133 | Good 84.8% |
| Syrians | 76.5 /100 | #134 | Good 84.8% |
| Immigrants | Hungary | 76.4 /100 | #135 | Good 84.8% |
| Bhutanese | 76.0 /100 | #136 | Good 84.8% |
| Immigrants | Canada | 73.5 /100 | #137 | Good 84.8% |
| Armenians | 72.7 /100 | #138 | Good 84.8% |
| Immigrants | Eastern Asia | 72.6 /100 | #139 | Good 84.8% |
| Immigrants | North America | 72.1 /100 | #140 | Good 84.8% |
Demographics Similar to Immigrants from Western Europe by In Labor Force | Age 25-29
In terms of in labor force | age 25-29, the demographic groups most similar to Immigrants from Western Europe are Immigrants from Vietnam (84.7%, a difference of 0.0%), Assyrian/Chaldean/Syriac (84.7%, a difference of 0.0%), Palestinian (84.7%, a difference of 0.0%), Celtic (84.7%, a difference of 0.010%), and Tongan (84.7%, a difference of 0.010%).
| Demographics | Rating | Rank | In Labor Force | Age 25-29 |
| Immigrants | Burma/Myanmar | 57.4 /100 | #165 | Average 84.7% |
| Immigrants | Spain | 56.9 /100 | #166 | Average 84.7% |
| Indonesians | 56.5 /100 | #167 | Average 84.7% |
| South Americans | 54.9 /100 | #168 | Average 84.7% |
| Celtics | 52.5 /100 | #169 | Average 84.7% |
| Tongans | 52.4 /100 | #170 | Average 84.7% |
| Immigrants | Vietnam | 50.5 /100 | #171 | Average 84.7% |
| Immigrants | Western Europe | 50.4 /100 | #172 | Average 84.7% |
| Assyrians/Chaldeans/Syriacs | 50.2 /100 | #173 | Average 84.7% |
| Palestinians | 50.0 /100 | #174 | Average 84.7% |
| Hungarians | 47.8 /100 | #175 | Average 84.6% |
| Malaysians | 46.8 /100 | #176 | Average 84.6% |
| Immigrants | China | 45.7 /100 | #177 | Average 84.6% |
| Immigrants | Thailand | 45.2 /100 | #178 | Average 84.6% |
| Immigrants | Argentina | 44.0 /100 | #179 | Average 84.6% |