Inupiat vs Immigrants from Western Europe Median Male Earnings
COMPARE
Inupiat
Immigrants from Western Europe
Median Male Earnings
Median Male Earnings Comparison
Inupiat
Immigrants from Western Europe
$47,281
MEDIAN MALE EARNINGS
0.1/ 100
METRIC RATING
296th/ 347
METRIC RANK
$60,334
MEDIAN MALE EARNINGS
99.7/ 100
METRIC RATING
72nd/ 347
METRIC RANK
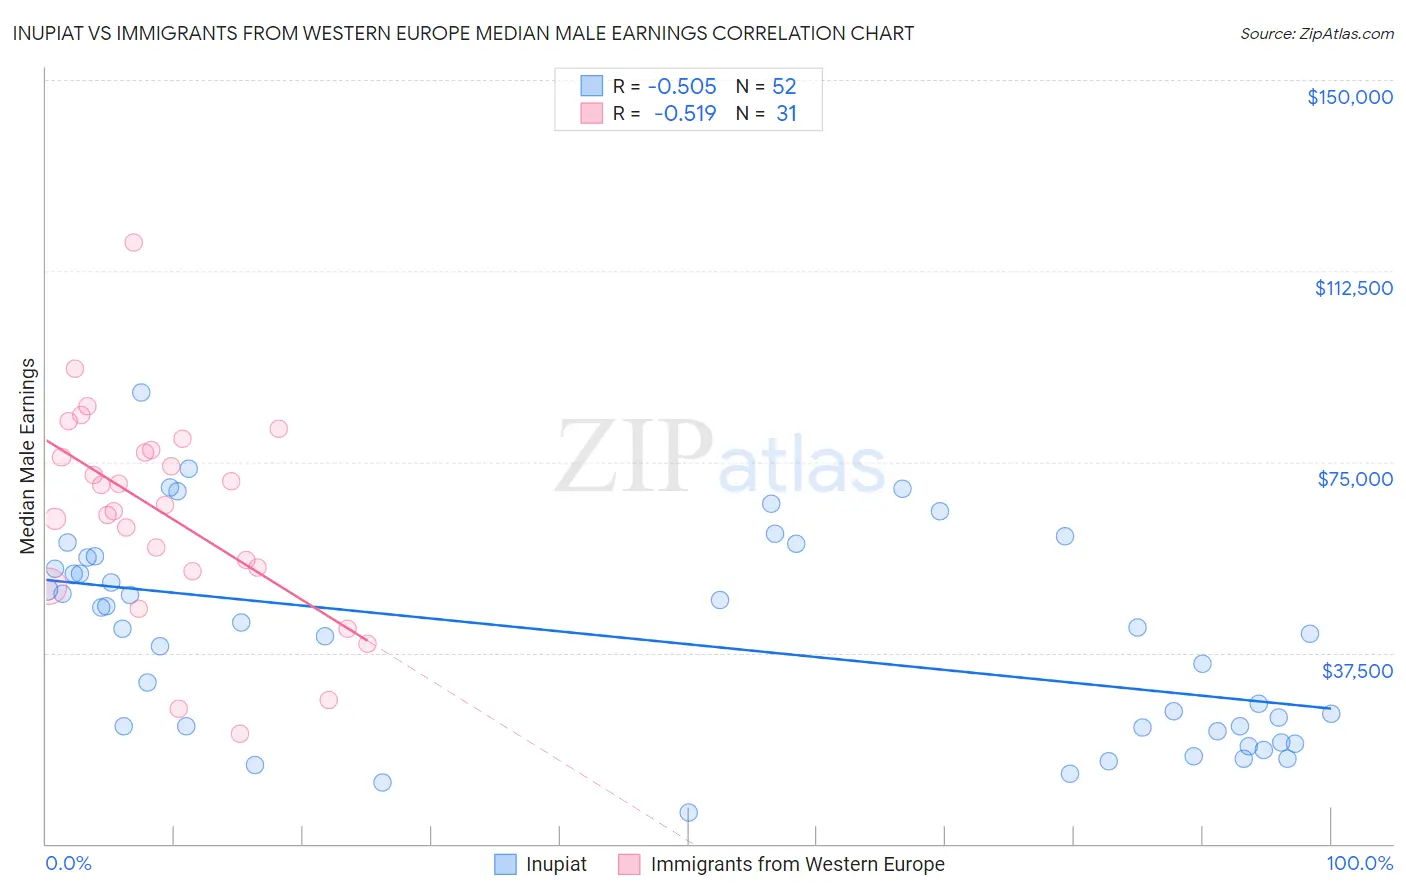
Inupiat vs Immigrants from Western Europe Median Male Earnings Correlation Chart
The statistical analysis conducted on geographies consisting of 96,323,006 people shows a substantial negative correlation between the proportion of Inupiat and median male earnings in the United States with a correlation coefficient (R) of -0.505 and weighted average of $47,281. Similarly, the statistical analysis conducted on geographies consisting of 493,675,126 people shows a substantial negative correlation between the proportion of Immigrants from Western Europe and median male earnings in the United States with a correlation coefficient (R) of -0.519 and weighted average of $60,334, a difference of 27.6%.
Median Male Earnings Correlation Summary
| Measurement | Inupiat | Immigrants from Western Europe |
| Minimum | $6,250 | $21,715 |
| Maximum | $88,594 | $118,110 |
| Range | $82,344 | $96,395 |
| Mean | $40,024 | $64,948 |
| Median | $41,688 | $66,494 |
| Interquartile 25% (IQ1) | $22,499 | $53,531 |
| Interquartile 75% (IQ3) | $55,179 | $77,220 |
| Interquartile Range (IQR) | $32,680 | $23,689 |
| Standard Deviation (Sample) | $19,878 | $20,607 |
| Standard Deviation (Population) | $19,686 | $20,272 |
Similar Demographics by Median Male Earnings
Demographics Similar to Inupiat by Median Male Earnings
In terms of median male earnings, the demographic groups most similar to Inupiat are Dominican ($47,204, a difference of 0.16%), Immigrants from Micronesia ($47,177, a difference of 0.22%), Central American Indian ($47,433, a difference of 0.32%), Immigrants from Nicaragua ($47,482, a difference of 0.43%), and Immigrants from Zaire ($47,070, a difference of 0.45%).
| Demographics | Rating | Rank | Median Male Earnings |
| Chickasaw | 0.1 /100 | #289 | Tragic $47,832 |
| Immigrants | Belize | 0.1 /100 | #290 | Tragic $47,809 |
| Choctaw | 0.1 /100 | #291 | Tragic $47,729 |
| Immigrants | Dominica | 0.1 /100 | #292 | Tragic $47,651 |
| Indonesians | 0.1 /100 | #293 | Tragic $47,503 |
| Immigrants | Nicaragua | 0.1 /100 | #294 | Tragic $47,482 |
| Central American Indians | 0.1 /100 | #295 | Tragic $47,433 |
| Inupiat | 0.1 /100 | #296 | Tragic $47,281 |
| Dominicans | 0.1 /100 | #297 | Tragic $47,204 |
| Immigrants | Micronesia | 0.1 /100 | #298 | Tragic $47,177 |
| Immigrants | Zaire | 0.1 /100 | #299 | Tragic $47,070 |
| U.S. Virgin Islanders | 0.1 /100 | #300 | Tragic $47,066 |
| Immigrants | Latin America | 0.1 /100 | #301 | Tragic $46,941 |
| Seminole | 0.1 /100 | #302 | Tragic $46,783 |
| Yaqui | 0.1 /100 | #303 | Tragic $46,777 |
Demographics Similar to Immigrants from Western Europe by Median Male Earnings
In terms of median male earnings, the demographic groups most similar to Immigrants from Western Europe are Mongolian ($60,350, a difference of 0.030%), Immigrants from Bulgaria ($60,358, a difference of 0.040%), Immigrants from Canada ($60,388, a difference of 0.090%), Immigrants from North America ($60,265, a difference of 0.12%), and Argentinean ($60,117, a difference of 0.36%).
| Demographics | Rating | Rank | Median Male Earnings |
| Immigrants | Indonesia | 99.8 /100 | #65 | Exceptional $60,935 |
| Immigrants | Croatia | 99.8 /100 | #66 | Exceptional $60,914 |
| Immigrants | Spain | 99.8 /100 | #67 | Exceptional $60,750 |
| Immigrants | Serbia | 99.7 /100 | #68 | Exceptional $60,600 |
| Immigrants | Canada | 99.7 /100 | #69 | Exceptional $60,388 |
| Immigrants | Bulgaria | 99.7 /100 | #70 | Exceptional $60,358 |
| Mongolians | 99.7 /100 | #71 | Exceptional $60,350 |
| Immigrants | Western Europe | 99.7 /100 | #72 | Exceptional $60,334 |
| Immigrants | North America | 99.7 /100 | #73 | Exceptional $60,265 |
| Argentineans | 99.6 /100 | #74 | Exceptional $60,117 |
| Immigrants | Bolivia | 99.6 /100 | #75 | Exceptional $60,088 |
| Romanians | 99.6 /100 | #76 | Exceptional $60,063 |
| Paraguayans | 99.5 /100 | #77 | Exceptional $59,975 |
| Immigrants | Egypt | 99.5 /100 | #78 | Exceptional $59,925 |
| Immigrants | Ukraine | 99.5 /100 | #79 | Exceptional $59,820 |