Immigrants from Jordan vs Immigrants from Western Europe Median Male Earnings
COMPARE
Immigrants from Jordan
Immigrants from Western Europe
Median Male Earnings
Median Male Earnings Comparison
Immigrants from Jordan
Immigrants from Western Europe
$57,145
MEDIAN MALE EARNINGS
93.1/ 100
METRIC RATING
122nd/ 347
METRIC RANK
$60,334
MEDIAN MALE EARNINGS
99.7/ 100
METRIC RATING
72nd/ 347
METRIC RANK
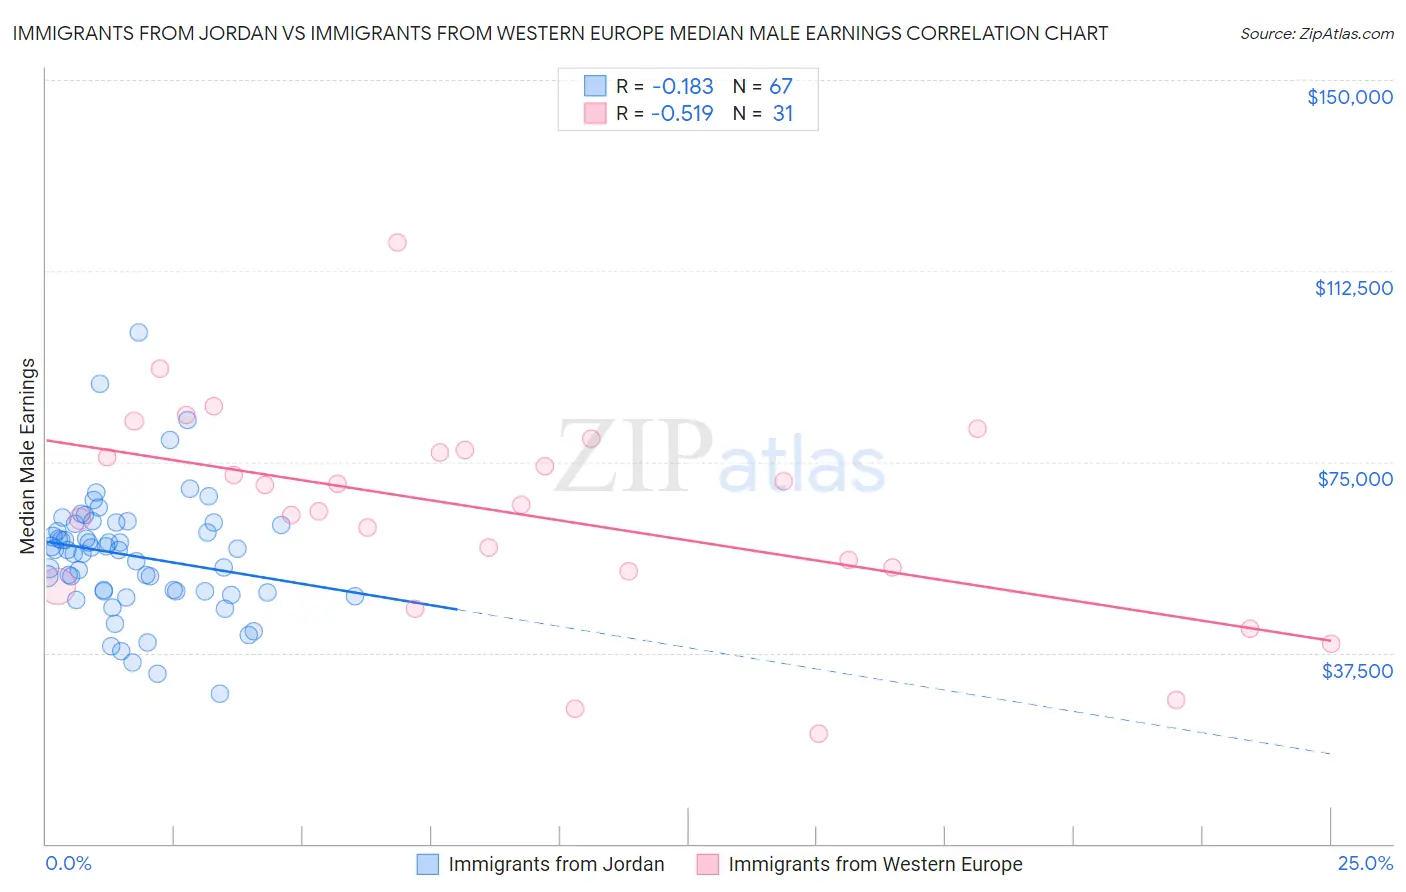
Immigrants from Jordan vs Immigrants from Western Europe Median Male Earnings Correlation Chart
The statistical analysis conducted on geographies consisting of 181,244,251 people shows a poor negative correlation between the proportion of Immigrants from Jordan and median male earnings in the United States with a correlation coefficient (R) of -0.183 and weighted average of $57,145. Similarly, the statistical analysis conducted on geographies consisting of 493,675,126 people shows a substantial negative correlation between the proportion of Immigrants from Western Europe and median male earnings in the United States with a correlation coefficient (R) of -0.519 and weighted average of $60,334, a difference of 5.6%.
Median Male Earnings Correlation Summary
| Measurement | Immigrants from Jordan | Immigrants from Western Europe |
| Minimum | $29,414 | $21,715 |
| Maximum | $100,501 | $118,110 |
| Range | $71,087 | $96,395 |
| Mean | $56,566 | $64,948 |
| Median | $57,678 | $66,494 |
| Interquartile 25% (IQ1) | $49,640 | $53,531 |
| Interquartile 75% (IQ3) | $62,778 | $77,220 |
| Interquartile Range (IQR) | $13,138 | $23,689 |
| Standard Deviation (Sample) | $12,126 | $20,607 |
| Standard Deviation (Population) | $12,035 | $20,272 |
Similar Demographics by Median Male Earnings
Demographics Similar to Immigrants from Jordan by Median Male Earnings
In terms of median male earnings, the demographic groups most similar to Immigrants from Jordan are Slovene ($57,145, a difference of 0.0%), Immigrants from Albania ($57,179, a difference of 0.060%), Canadian ($57,286, a difference of 0.25%), Arab ($57,298, a difference of 0.27%), and Hungarian ($57,309, a difference of 0.29%).
| Demographics | Rating | Rank | Median Male Earnings |
| Swedes | 94.8 /100 | #115 | Exceptional $57,445 |
| Lebanese | 94.6 /100 | #116 | Exceptional $57,409 |
| Immigrants | Zimbabwe | 94.3 /100 | #117 | Exceptional $57,352 |
| Hungarians | 94.0 /100 | #118 | Exceptional $57,309 |
| Arabs | 94.0 /100 | #119 | Exceptional $57,298 |
| Canadians | 93.9 /100 | #120 | Exceptional $57,286 |
| Immigrants | Albania | 93.3 /100 | #121 | Exceptional $57,179 |
| Immigrants | Jordan | 93.1 /100 | #122 | Exceptional $57,145 |
| Slovenes | 93.1 /100 | #123 | Exceptional $57,145 |
| Chileans | 91.9 /100 | #124 | Exceptional $56,973 |
| Immigrants | Morocco | 91.8 /100 | #125 | Exceptional $56,958 |
| Chinese | 91.1 /100 | #126 | Exceptional $56,872 |
| Brazilians | 90.9 /100 | #127 | Exceptional $56,837 |
| Immigrants | Syria | 90.8 /100 | #128 | Exceptional $56,830 |
| Pakistanis | 89.9 /100 | #129 | Excellent $56,719 |
Demographics Similar to Immigrants from Western Europe by Median Male Earnings
In terms of median male earnings, the demographic groups most similar to Immigrants from Western Europe are Mongolian ($60,350, a difference of 0.030%), Immigrants from Bulgaria ($60,358, a difference of 0.040%), Immigrants from Canada ($60,388, a difference of 0.090%), Immigrants from North America ($60,265, a difference of 0.12%), and Argentinean ($60,117, a difference of 0.36%).
| Demographics | Rating | Rank | Median Male Earnings |
| Immigrants | Indonesia | 99.8 /100 | #65 | Exceptional $60,935 |
| Immigrants | Croatia | 99.8 /100 | #66 | Exceptional $60,914 |
| Immigrants | Spain | 99.8 /100 | #67 | Exceptional $60,750 |
| Immigrants | Serbia | 99.7 /100 | #68 | Exceptional $60,600 |
| Immigrants | Canada | 99.7 /100 | #69 | Exceptional $60,388 |
| Immigrants | Bulgaria | 99.7 /100 | #70 | Exceptional $60,358 |
| Mongolians | 99.7 /100 | #71 | Exceptional $60,350 |
| Immigrants | Western Europe | 99.7 /100 | #72 | Exceptional $60,334 |
| Immigrants | North America | 99.7 /100 | #73 | Exceptional $60,265 |
| Argentineans | 99.6 /100 | #74 | Exceptional $60,117 |
| Immigrants | Bolivia | 99.6 /100 | #75 | Exceptional $60,088 |
| Romanians | 99.6 /100 | #76 | Exceptional $60,063 |
| Paraguayans | 99.5 /100 | #77 | Exceptional $59,975 |
| Immigrants | Egypt | 99.5 /100 | #78 | Exceptional $59,925 |
| Immigrants | Ukraine | 99.5 /100 | #79 | Exceptional $59,820 |