Pima vs Immigrants from Caribbean Median Earnings
COMPARE
Pima
Immigrants from Caribbean
Median Earnings
Median Earnings Comparison
Pima
Immigrants from Caribbean
$38,285
MEDIAN EARNINGS
0.0/ 100
METRIC RATING
338th/ 347
METRIC RANK
$41,119
MEDIAN EARNINGS
0.1/ 100
METRIC RATING
299th/ 347
METRIC RANK
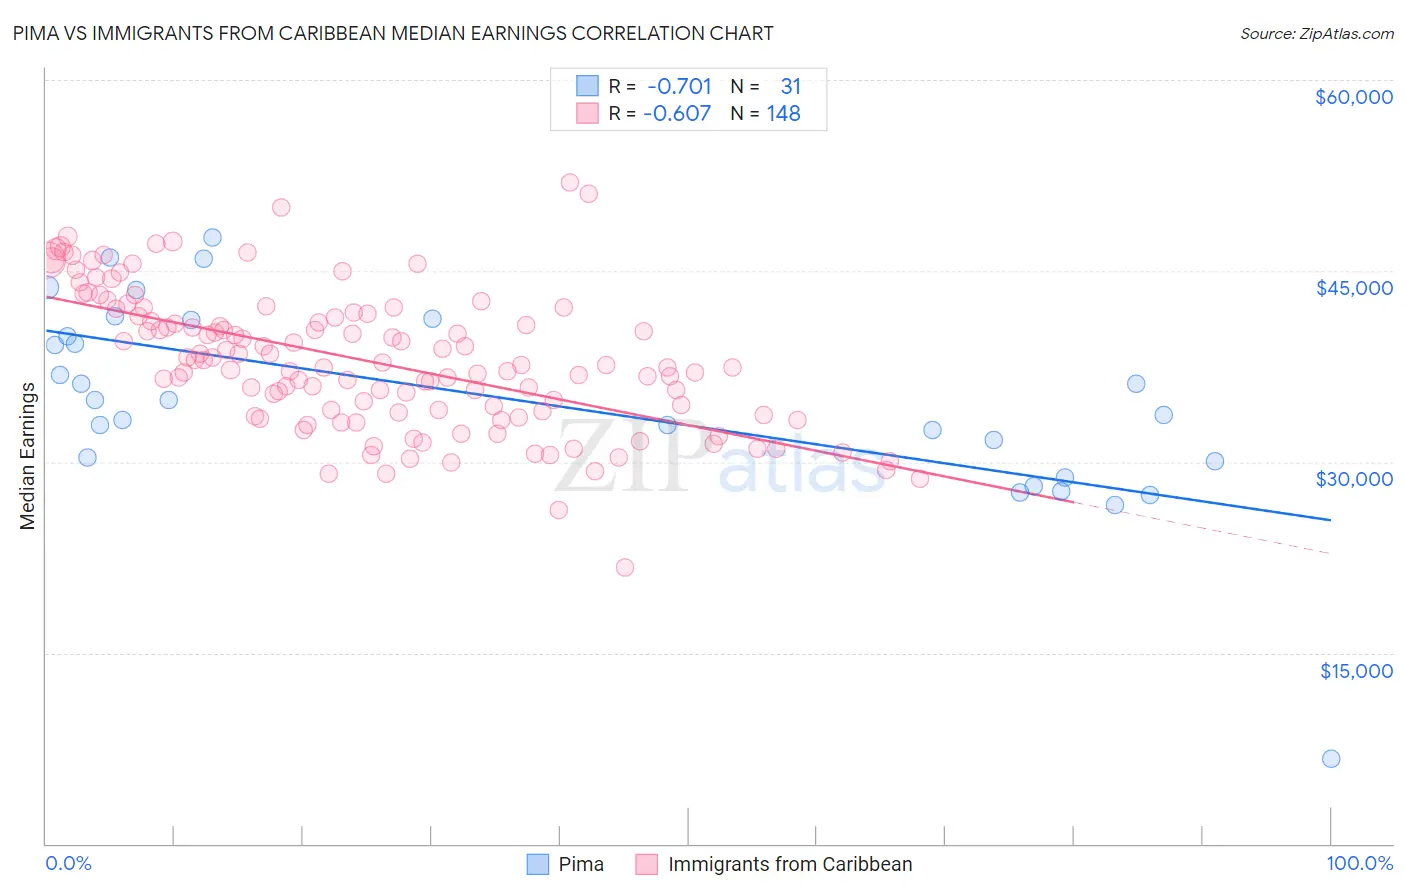
Pima vs Immigrants from Caribbean Median Earnings Correlation Chart
The statistical analysis conducted on geographies consisting of 61,551,762 people shows a strong negative correlation between the proportion of Pima and median earnings in the United States with a correlation coefficient (R) of -0.701 and weighted average of $38,285. Similarly, the statistical analysis conducted on geographies consisting of 450,013,484 people shows a significant negative correlation between the proportion of Immigrants from Caribbean and median earnings in the United States with a correlation coefficient (R) of -0.607 and weighted average of $41,119, a difference of 7.4%.
Median Earnings Correlation Summary
| Measurement | Pima | Immigrants from Caribbean |
| Minimum | $6,642 | $21,741 |
| Maximum | $47,578 | $51,911 |
| Range | $40,936 | $30,170 |
| Mean | $34,771 | $37,958 |
| Median | $34,844 | $37,629 |
| Interquartile 25% (IQ1) | $30,058 | $33,921 |
| Interquartile 75% (IQ3) | $41,158 | $41,541 |
| Interquartile Range (IQR) | $11,100 | $7,620 |
| Standard Deviation (Sample) | $8,029 | $5,439 |
| Standard Deviation (Population) | $7,898 | $5,421 |
Similar Demographics by Median Earnings
Demographics Similar to Pima by Median Earnings
In terms of median earnings, the demographic groups most similar to Pima are Immigrants from Cuba ($38,426, a difference of 0.37%), Menominee ($37,884, a difference of 1.1%), Crow ($38,707, a difference of 1.1%), Native/Alaskan ($38,896, a difference of 1.6%), and Spanish American Indian ($38,907, a difference of 1.6%).
| Demographics | Rating | Rank | Median Earnings |
| Immigrants | Mexico | 0.0 /100 | #331 | Tragic $39,114 |
| Yakama | 0.0 /100 | #332 | Tragic $39,107 |
| Houma | 0.0 /100 | #333 | Tragic $38,949 |
| Spanish American Indians | 0.0 /100 | #334 | Tragic $38,907 |
| Natives/Alaskans | 0.0 /100 | #335 | Tragic $38,896 |
| Crow | 0.0 /100 | #336 | Tragic $38,707 |
| Immigrants | Cuba | 0.0 /100 | #337 | Tragic $38,426 |
| Pima | 0.0 /100 | #338 | Tragic $38,285 |
| Menominee | 0.0 /100 | #339 | Tragic $37,884 |
| Navajo | 0.0 /100 | #340 | Tragic $36,999 |
| Lumbee | 0.0 /100 | #341 | Tragic $36,876 |
| Hopi | 0.0 /100 | #342 | Tragic $36,871 |
| Pueblo | 0.0 /100 | #343 | Tragic $36,859 |
| Arapaho | 0.0 /100 | #344 | Tragic $36,586 |
| Tohono O'odham | 0.0 /100 | #345 | Tragic $36,349 |
Demographics Similar to Immigrants from Caribbean by Median Earnings
In terms of median earnings, the demographic groups most similar to Immigrants from Caribbean are Immigrants from Micronesia ($41,133, a difference of 0.030%), Ute ($41,051, a difference of 0.17%), Immigrants from Latin America ($41,049, a difference of 0.17%), Guatemalan ($41,205, a difference of 0.21%), and Cherokee ($41,252, a difference of 0.32%).
| Demographics | Rating | Rank | Median Earnings |
| U.S. Virgin Islanders | 0.1 /100 | #292 | Tragic $41,448 |
| Immigrants | Zaire | 0.1 /100 | #293 | Tragic $41,325 |
| Potawatomi | 0.1 /100 | #294 | Tragic $41,288 |
| Bangladeshis | 0.1 /100 | #295 | Tragic $41,263 |
| Cherokee | 0.1 /100 | #296 | Tragic $41,252 |
| Guatemalans | 0.1 /100 | #297 | Tragic $41,205 |
| Immigrants | Micronesia | 0.1 /100 | #298 | Tragic $41,133 |
| Immigrants | Caribbean | 0.1 /100 | #299 | Tragic $41,119 |
| Ute | 0.1 /100 | #300 | Tragic $41,051 |
| Immigrants | Latin America | 0.1 /100 | #301 | Tragic $41,049 |
| Shoshone | 0.0 /100 | #302 | Tragic $40,932 |
| Haitians | 0.0 /100 | #303 | Tragic $40,918 |
| Immigrants | Guatemala | 0.0 /100 | #304 | Tragic $40,851 |
| Chickasaw | 0.0 /100 | #305 | Tragic $40,672 |
| Yaqui | 0.0 /100 | #306 | Tragic $40,647 |