Immigrants from Colombia vs Immigrants from Caribbean Median Earnings
COMPARE
Immigrants from Colombia
Immigrants from Caribbean
Median Earnings
Median Earnings Comparison
Immigrants from Colombia
Immigrants from Caribbean
$45,550
MEDIAN EARNINGS
22.4/ 100
METRIC RATING
213th/ 347
METRIC RANK
$41,119
MEDIAN EARNINGS
0.1/ 100
METRIC RATING
299th/ 347
METRIC RANK
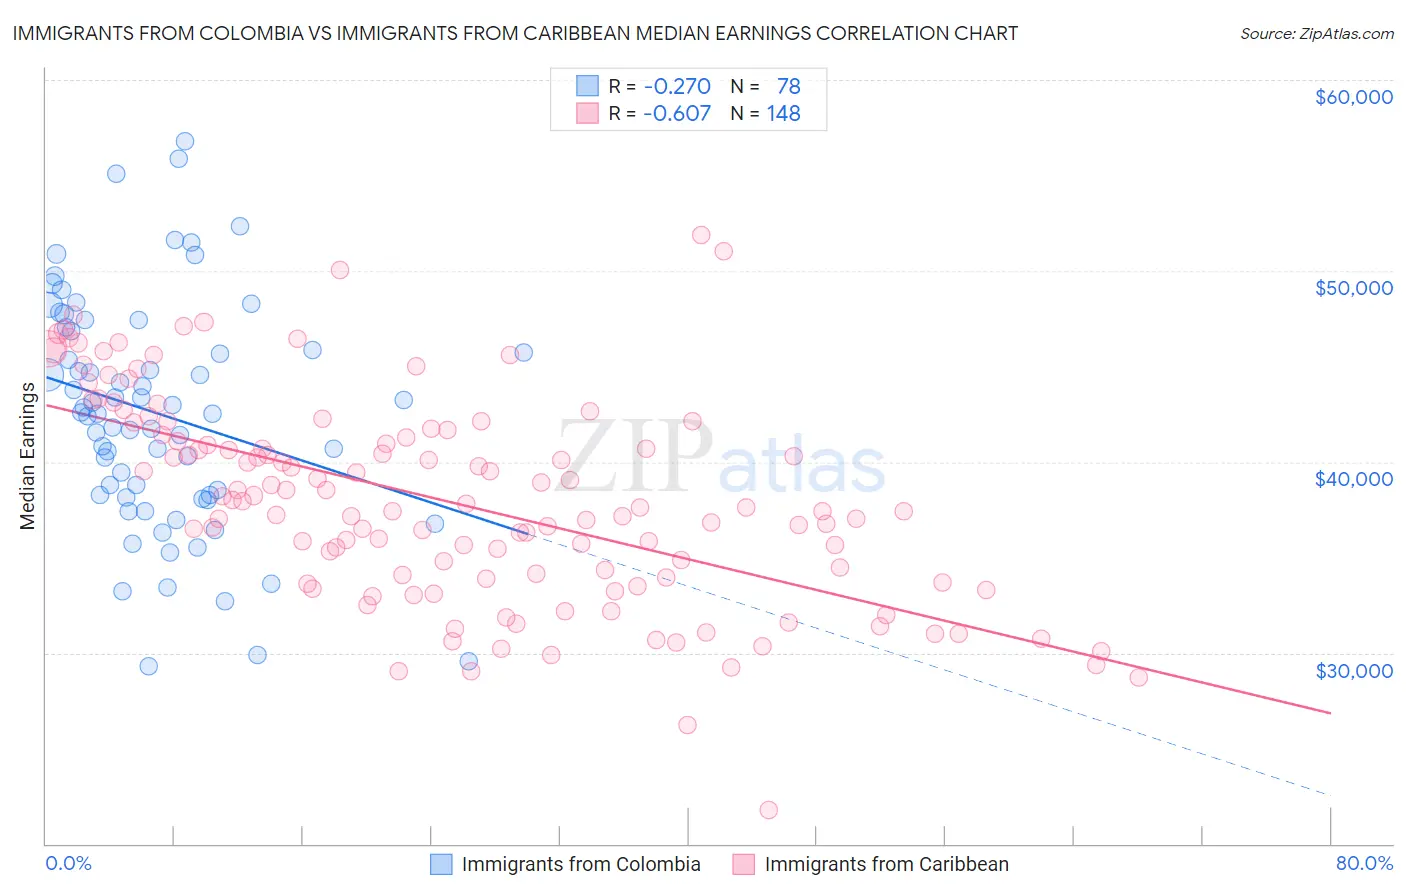
Immigrants from Colombia vs Immigrants from Caribbean Median Earnings Correlation Chart
The statistical analysis conducted on geographies consisting of 378,647,626 people shows a weak negative correlation between the proportion of Immigrants from Colombia and median earnings in the United States with a correlation coefficient (R) of -0.270 and weighted average of $45,550. Similarly, the statistical analysis conducted on geographies consisting of 450,013,484 people shows a significant negative correlation between the proportion of Immigrants from Caribbean and median earnings in the United States with a correlation coefficient (R) of -0.607 and weighted average of $41,119, a difference of 10.8%.
Median Earnings Correlation Summary
| Measurement | Immigrants from Colombia | Immigrants from Caribbean |
| Minimum | $29,284 | $21,741 |
| Maximum | $56,800 | $51,911 |
| Range | $27,517 | $30,170 |
| Mean | $42,514 | $37,958 |
| Median | $42,568 | $37,629 |
| Interquartile 25% (IQ1) | $38,241 | $33,921 |
| Interquartile 75% (IQ3) | $46,823 | $41,541 |
| Interquartile Range (IQR) | $8,582 | $7,620 |
| Standard Deviation (Sample) | $5,984 | $5,439 |
| Standard Deviation (Population) | $5,945 | $5,421 |
Similar Demographics by Median Earnings
Demographics Similar to Immigrants from Colombia by Median Earnings
In terms of median earnings, the demographic groups most similar to Immigrants from Colombia are Nigerian ($45,532, a difference of 0.040%), Immigrants from Bangladesh ($45,532, a difference of 0.040%), Immigrants from Grenada ($45,596, a difference of 0.10%), Panamanian ($45,593, a difference of 0.10%), and Bermudan ($45,593, a difference of 0.10%).
| Demographics | Rating | Rank | Median Earnings |
| Immigrants | Ghana | 24.8 /100 | #206 | Fair $45,641 |
| Immigrants | Senegal | 24.0 /100 | #207 | Fair $45,611 |
| Immigrants | Bosnia and Herzegovina | 23.7 /100 | #208 | Fair $45,600 |
| Immigrants | Thailand | 23.7 /100 | #209 | Fair $45,598 |
| Immigrants | Grenada | 23.6 /100 | #210 | Fair $45,596 |
| Panamanians | 23.5 /100 | #211 | Fair $45,593 |
| Bermudans | 23.5 /100 | #212 | Fair $45,593 |
| Immigrants | Colombia | 22.4 /100 | #213 | Fair $45,550 |
| Nigerians | 22.0 /100 | #214 | Fair $45,532 |
| Immigrants | Bangladesh | 22.0 /100 | #215 | Fair $45,532 |
| Guyanese | 20.6 /100 | #216 | Fair $45,470 |
| Tlingit-Haida | 20.5 /100 | #217 | Fair $45,468 |
| Spanish | 19.7 /100 | #218 | Poor $45,432 |
| Dutch | 18.4 /100 | #219 | Poor $45,370 |
| Ecuadorians | 15.3 /100 | #220 | Poor $45,214 |
Demographics Similar to Immigrants from Caribbean by Median Earnings
In terms of median earnings, the demographic groups most similar to Immigrants from Caribbean are Immigrants from Micronesia ($41,133, a difference of 0.030%), Ute ($41,051, a difference of 0.17%), Immigrants from Latin America ($41,049, a difference of 0.17%), Guatemalan ($41,205, a difference of 0.21%), and Cherokee ($41,252, a difference of 0.32%).
| Demographics | Rating | Rank | Median Earnings |
| U.S. Virgin Islanders | 0.1 /100 | #292 | Tragic $41,448 |
| Immigrants | Zaire | 0.1 /100 | #293 | Tragic $41,325 |
| Potawatomi | 0.1 /100 | #294 | Tragic $41,288 |
| Bangladeshis | 0.1 /100 | #295 | Tragic $41,263 |
| Cherokee | 0.1 /100 | #296 | Tragic $41,252 |
| Guatemalans | 0.1 /100 | #297 | Tragic $41,205 |
| Immigrants | Micronesia | 0.1 /100 | #298 | Tragic $41,133 |
| Immigrants | Caribbean | 0.1 /100 | #299 | Tragic $41,119 |
| Ute | 0.1 /100 | #300 | Tragic $41,051 |
| Immigrants | Latin America | 0.1 /100 | #301 | Tragic $41,049 |
| Shoshone | 0.0 /100 | #302 | Tragic $40,932 |
| Haitians | 0.0 /100 | #303 | Tragic $40,918 |
| Immigrants | Guatemala | 0.0 /100 | #304 | Tragic $40,851 |
| Chickasaw | 0.0 /100 | #305 | Tragic $40,672 |
| Yaqui | 0.0 /100 | #306 | Tragic $40,647 |