Armenian vs Spanish American 11th Grade
COMPARE
Armenian
Spanish American
11th Grade
11th Grade Comparison
Armenians
Spanish Americans
91.7%
11TH GRADE
2.9/ 100
METRIC RATING
234th/ 347
METRIC RANK
91.4%
11TH GRADE
0.6/ 100
METRIC RATING
260th/ 347
METRIC RANK
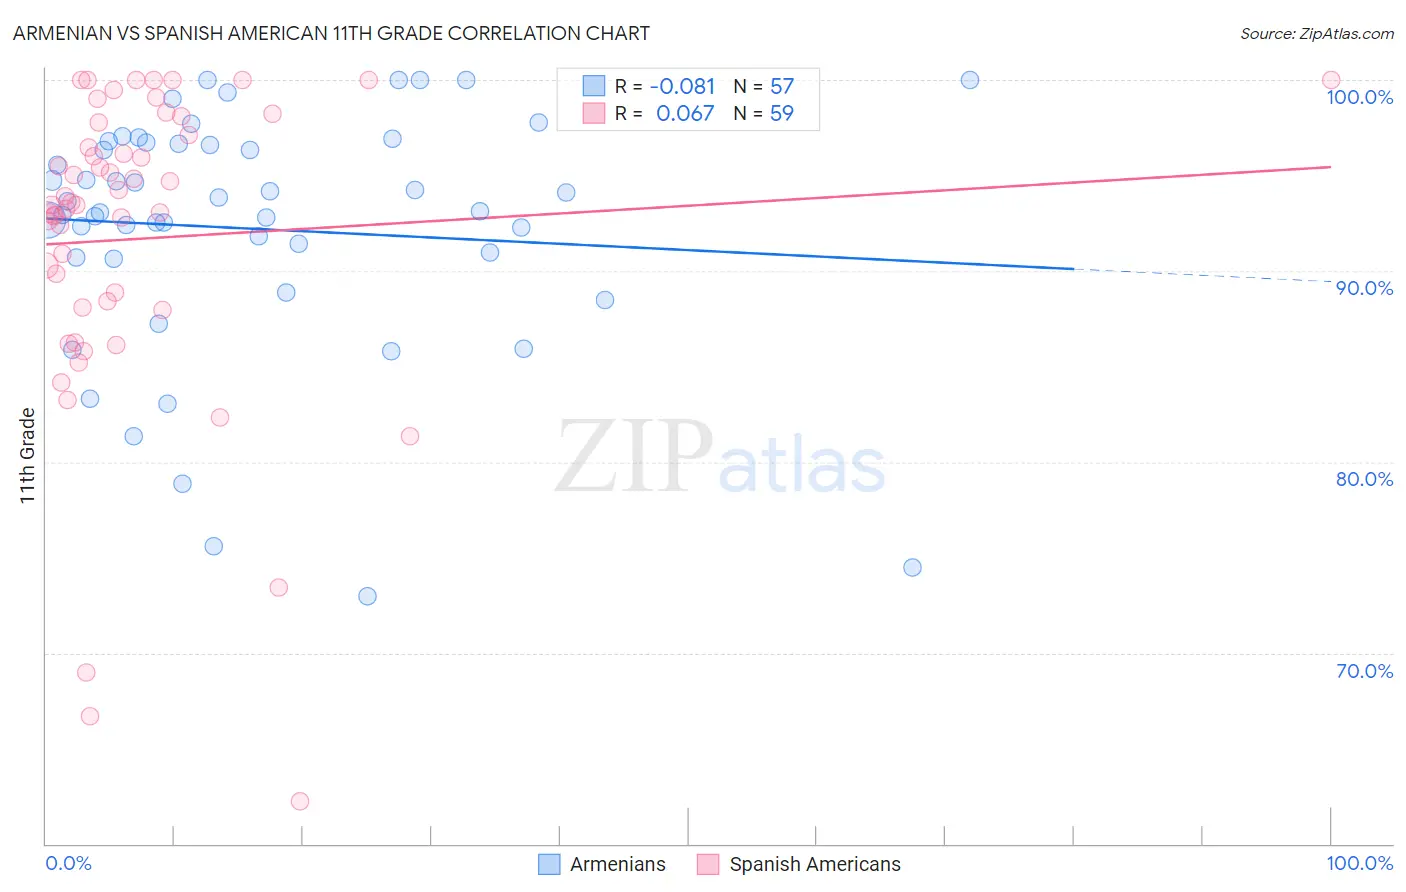
Armenian vs Spanish American 11th Grade Correlation Chart
The statistical analysis conducted on geographies consisting of 310,954,801 people shows a slight negative correlation between the proportion of Armenians and percentage of population with at least 11th grade education in the United States with a correlation coefficient (R) of -0.081 and weighted average of 91.7%. Similarly, the statistical analysis conducted on geographies consisting of 103,168,542 people shows a slight positive correlation between the proportion of Spanish Americans and percentage of population with at least 11th grade education in the United States with a correlation coefficient (R) of 0.067 and weighted average of 91.4%, a difference of 0.40%.
11th Grade Correlation Summary
| Measurement | Armenian | Spanish American |
| Minimum | 73.0% | 62.3% |
| Maximum | 100.0% | 100.0% |
| Range | 27.0% | 37.7% |
| Mean | 92.2% | 91.7% |
| Median | 93.1% | 93.5% |
| Interquartile 25% (IQ1) | 90.7% | 88.1% |
| Interquartile 75% (IQ3) | 96.7% | 97.8% |
| Interquartile Range (IQR) | 6.0% | 9.7% |
| Standard Deviation (Sample) | 6.4% | 8.3% |
| Standard Deviation (Population) | 6.4% | 8.2% |
Similar Demographics by 11th Grade
Demographics Similar to Armenians by 11th Grade
In terms of 11th grade, the demographic groups most similar to Armenians are Subsaharan African (91.7%, a difference of 0.0%), Colombian (91.7%, a difference of 0.010%), Immigrants from Bolivia (91.7%, a difference of 0.010%), Cheyenne (91.8%, a difference of 0.030%), and Comanche (91.7%, a difference of 0.030%).
| Demographics | Rating | Rank | 11th Grade |
| Immigrants | Cameroon | 4.4 /100 | #227 | Tragic 91.8% |
| Immigrants | Panama | 4.3 /100 | #228 | Tragic 91.8% |
| Nigerians | 4.3 /100 | #229 | Tragic 91.8% |
| Immigrants | Afghanistan | 3.9 /100 | #230 | Tragic 91.8% |
| Choctaw | 3.7 /100 | #231 | Tragic 91.8% |
| Uruguayans | 3.5 /100 | #232 | Tragic 91.8% |
| Cheyenne | 3.3 /100 | #233 | Tragic 91.8% |
| Armenians | 2.9 /100 | #234 | Tragic 91.7% |
| Sub-Saharan Africans | 2.9 /100 | #235 | Tragic 91.7% |
| Colombians | 2.8 /100 | #236 | Tragic 91.7% |
| Immigrants | Bolivia | 2.8 /100 | #237 | Tragic 91.7% |
| Comanche | 2.6 /100 | #238 | Tragic 91.7% |
| Hopi | 2.5 /100 | #239 | Tragic 91.7% |
| South Americans | 2.0 /100 | #240 | Tragic 91.6% |
| Bahamians | 1.8 /100 | #241 | Tragic 91.6% |
Demographics Similar to Spanish Americans by 11th Grade
In terms of 11th grade, the demographic groups most similar to Spanish Americans are Jamaican (91.4%, a difference of 0.010%), Taiwanese (91.3%, a difference of 0.010%), Immigrants from Colombia (91.4%, a difference of 0.020%), Immigrants from Uruguay (91.3%, a difference of 0.020%), and Cajun (91.4%, a difference of 0.040%).
| Demographics | Rating | Rank | 11th Grade |
| Immigrants | South America | 0.8 /100 | #253 | Tragic 91.4% |
| Immigrants | Eritrea | 0.7 /100 | #254 | Tragic 91.4% |
| Blacks/African Americans | 0.7 /100 | #255 | Tragic 91.4% |
| Immigrants | Senegal | 0.7 /100 | #256 | Tragic 91.4% |
| Cajuns | 0.7 /100 | #257 | Tragic 91.4% |
| Immigrants | Colombia | 0.6 /100 | #258 | Tragic 91.4% |
| Jamaicans | 0.6 /100 | #259 | Tragic 91.4% |
| Spanish Americans | 0.6 /100 | #260 | Tragic 91.4% |
| Taiwanese | 0.6 /100 | #261 | Tragic 91.3% |
| Immigrants | Uruguay | 0.5 /100 | #262 | Tragic 91.3% |
| Immigrants | Ghana | 0.3 /100 | #263 | Tragic 91.2% |
| Yup'ik | 0.3 /100 | #264 | Tragic 91.2% |
| Pueblo | 0.3 /100 | #265 | Tragic 91.2% |
| Immigrants | Western Africa | 0.3 /100 | #266 | Tragic 91.2% |
| Immigrants | Jamaica | 0.3 /100 | #267 | Tragic 91.2% |