Canadian vs Spanish American Median Family Income
COMPARE
Canadian
Spanish American
Median Family Income
Median Family Income Comparison
Canadians
Spanish Americans
$106,597
MEDIAN FAMILY INCOME
88.1/ 100
METRIC RATING
131st/ 347
METRIC RANK
$90,322
MEDIAN FAMILY INCOME
0.2/ 100
METRIC RATING
274th/ 347
METRIC RANK
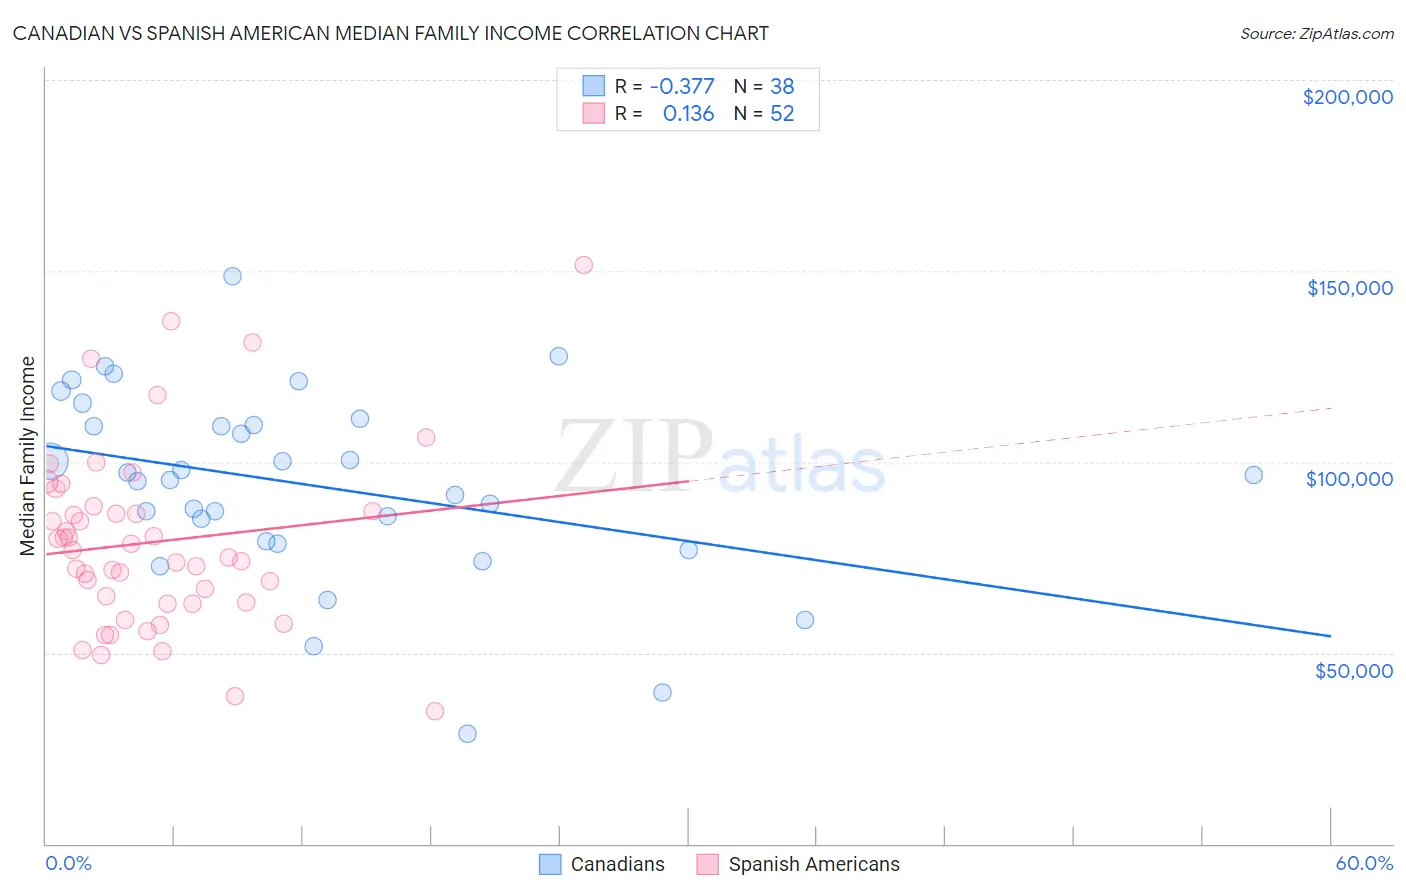
Canadian vs Spanish American Median Family Income Correlation Chart
The statistical analysis conducted on geographies consisting of 437,117,064 people shows a mild negative correlation between the proportion of Canadians and median family income in the United States with a correlation coefficient (R) of -0.377 and weighted average of $106,597. Similarly, the statistical analysis conducted on geographies consisting of 103,155,631 people shows a poor positive correlation between the proportion of Spanish Americans and median family income in the United States with a correlation coefficient (R) of 0.136 and weighted average of $90,322, a difference of 18.0%.
Median Family Income Correlation Summary
| Measurement | Canadian | Spanish American |
| Minimum | $28,715 | $34,804 |
| Maximum | $148,748 | $151,435 |
| Range | $120,033 | $116,631 |
| Mean | $93,902 | $79,090 |
| Median | $95,805 | $75,945 |
| Interquartile 25% (IQ1) | $79,333 | $62,996 |
| Interquartile 75% (IQ3) | $109,797 | $87,771 |
| Interquartile Range (IQR) | $30,464 | $24,775 |
| Standard Deviation (Sample) | $24,866 | $23,819 |
| Standard Deviation (Population) | $24,537 | $23,588 |
Similar Demographics by Median Family Income
Demographics Similar to Canadians by Median Family Income
In terms of median family income, the demographic groups most similar to Canadians are Immigrants from Fiji ($106,544, a difference of 0.050%), Ugandan ($106,541, a difference of 0.050%), Immigrants from Oceania ($106,453, a difference of 0.14%), Portuguese ($106,286, a difference of 0.29%), and Brazilian ($106,942, a difference of 0.32%).
| Demographics | Rating | Rank | Median Family Income |
| Pakistanis | 91.7 /100 | #124 | Exceptional $107,390 |
| Taiwanese | 91.4 /100 | #125 | Exceptional $107,295 |
| Serbians | 90.8 /100 | #126 | Exceptional $107,157 |
| Lebanese | 90.5 /100 | #127 | Exceptional $107,086 |
| Immigrants | Ethiopia | 90.0 /100 | #128 | Excellent $106,969 |
| Arabs | 89.9 /100 | #129 | Excellent $106,952 |
| Brazilians | 89.8 /100 | #130 | Excellent $106,942 |
| Canadians | 88.1 /100 | #131 | Excellent $106,597 |
| Immigrants | Fiji | 87.8 /100 | #132 | Excellent $106,544 |
| Ugandans | 87.8 /100 | #133 | Excellent $106,541 |
| Immigrants | Oceania | 87.3 /100 | #134 | Excellent $106,453 |
| Portuguese | 86.3 /100 | #135 | Excellent $106,286 |
| Immigrants | South Eastern Asia | 86.1 /100 | #136 | Excellent $106,252 |
| Immigrants | Uganda | 85.7 /100 | #137 | Excellent $106,188 |
| Immigrants | Vietnam | 85.7 /100 | #138 | Excellent $106,186 |
Demographics Similar to Spanish Americans by Median Family Income
In terms of median family income, the demographic groups most similar to Spanish Americans are Immigrants from Micronesia ($90,345, a difference of 0.020%), Immigrants from Liberia ($90,450, a difference of 0.14%), Iroquois ($90,543, a difference of 0.24%), Immigrants from St. Vincent and the Grenadines ($90,094, a difference of 0.25%), and Jamaican ($90,581, a difference of 0.29%).
| Demographics | Rating | Rank | Median Family Income |
| Mexican American Indians | 0.2 /100 | #267 | Tragic $90,918 |
| Cree | 0.2 /100 | #268 | Tragic $90,882 |
| Belizeans | 0.2 /100 | #269 | Tragic $90,880 |
| Jamaicans | 0.2 /100 | #270 | Tragic $90,581 |
| Iroquois | 0.2 /100 | #271 | Tragic $90,543 |
| Immigrants | Liberia | 0.2 /100 | #272 | Tragic $90,450 |
| Immigrants | Micronesia | 0.2 /100 | #273 | Tragic $90,345 |
| Spanish Americans | 0.2 /100 | #274 | Tragic $90,322 |
| Immigrants | St. Vincent and the Grenadines | 0.2 /100 | #275 | Tragic $90,094 |
| Immigrants | Zaire | 0.1 /100 | #276 | Tragic $89,285 |
| Immigrants | Jamaica | 0.1 /100 | #277 | Tragic $89,268 |
| Immigrants | Grenada | 0.1 /100 | #278 | Tragic $89,249 |
| Immigrants | Belize | 0.1 /100 | #279 | Tragic $89,197 |
| British West Indians | 0.1 /100 | #280 | Tragic $88,987 |
| Blackfeet | 0.1 /100 | #281 | Tragic $88,717 |