Sri Lankan vs Spanish American Median Family Income
COMPARE
Sri Lankan
Spanish American
Median Family Income
Median Family Income Comparison
Sri Lankans
Spanish Americans
$108,234
MEDIAN FAMILY INCOME
94.5/ 100
METRIC RATING
119th/ 347
METRIC RANK
$90,322
MEDIAN FAMILY INCOME
0.2/ 100
METRIC RATING
274th/ 347
METRIC RANK
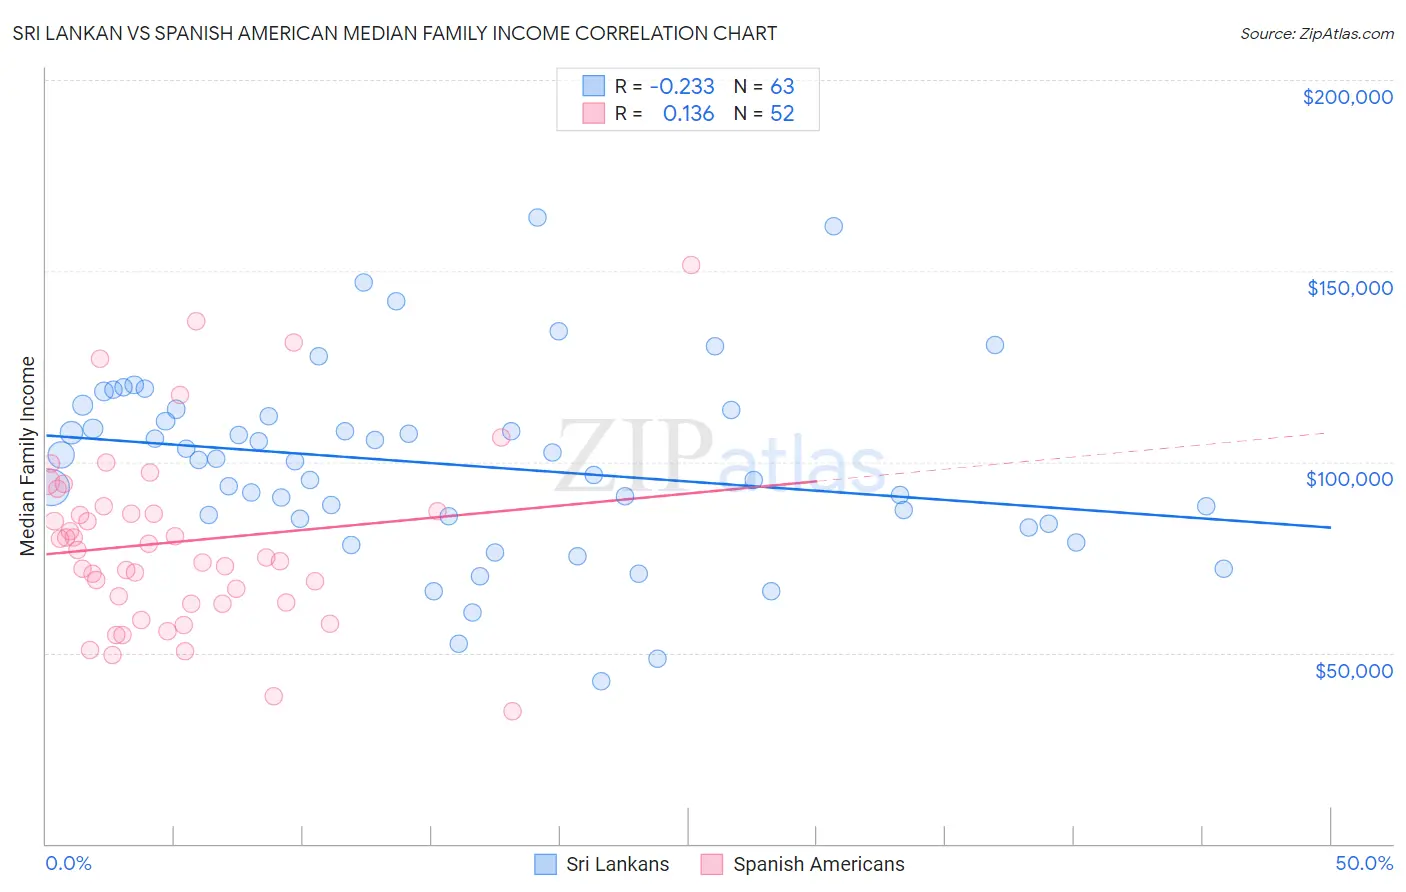
Sri Lankan vs Spanish American Median Family Income Correlation Chart
The statistical analysis conducted on geographies consisting of 439,902,823 people shows a weak negative correlation between the proportion of Sri Lankans and median family income in the United States with a correlation coefficient (R) of -0.233 and weighted average of $108,234. Similarly, the statistical analysis conducted on geographies consisting of 103,155,631 people shows a poor positive correlation between the proportion of Spanish Americans and median family income in the United States with a correlation coefficient (R) of 0.136 and weighted average of $90,322, a difference of 19.8%.
Median Family Income Correlation Summary
| Measurement | Sri Lankan | Spanish American |
| Minimum | $42,404 | $34,804 |
| Maximum | $164,143 | $151,435 |
| Range | $121,739 | $116,631 |
| Mean | $99,316 | $79,090 |
| Median | $100,475 | $75,945 |
| Interquartile 25% (IQ1) | $84,952 | $62,996 |
| Interquartile 75% (IQ3) | $113,711 | $87,771 |
| Interquartile Range (IQR) | $28,760 | $24,775 |
| Standard Deviation (Sample) | $24,633 | $23,819 |
| Standard Deviation (Population) | $24,437 | $23,588 |
Similar Demographics by Median Family Income
Demographics Similar to Sri Lankans by Median Family Income
In terms of median family income, the demographic groups most similar to Sri Lankans are Ethiopian ($108,251, a difference of 0.020%), Immigrants from Philippines ($108,288, a difference of 0.050%), Immigrants from Northern Africa ($108,161, a difference of 0.070%), European ($108,099, a difference of 0.12%), and Chilean ($108,429, a difference of 0.18%).
| Demographics | Rating | Rank | Median Family Income |
| Immigrants | Poland | 95.3 /100 | #112 | Exceptional $108,570 |
| Immigrants | Saudi Arabia | 95.2 /100 | #113 | Exceptional $108,544 |
| Poles | 95.2 /100 | #114 | Exceptional $108,507 |
| Swedes | 95.1 /100 | #115 | Exceptional $108,499 |
| Chileans | 95.0 /100 | #116 | Exceptional $108,429 |
| Immigrants | Philippines | 94.6 /100 | #117 | Exceptional $108,288 |
| Ethiopians | 94.5 /100 | #118 | Exceptional $108,251 |
| Sri Lankans | 94.5 /100 | #119 | Exceptional $108,234 |
| Immigrants | Northern Africa | 94.3 /100 | #120 | Exceptional $108,161 |
| Europeans | 94.1 /100 | #121 | Exceptional $108,099 |
| Immigrants | Jordan | 92.9 /100 | #122 | Exceptional $107,715 |
| Carpatho Rusyns | 92.2 /100 | #123 | Exceptional $107,502 |
| Pakistanis | 91.7 /100 | #124 | Exceptional $107,390 |
| Taiwanese | 91.4 /100 | #125 | Exceptional $107,295 |
| Serbians | 90.8 /100 | #126 | Exceptional $107,157 |
Demographics Similar to Spanish Americans by Median Family Income
In terms of median family income, the demographic groups most similar to Spanish Americans are Immigrants from Micronesia ($90,345, a difference of 0.020%), Immigrants from Liberia ($90,450, a difference of 0.14%), Iroquois ($90,543, a difference of 0.24%), Immigrants from St. Vincent and the Grenadines ($90,094, a difference of 0.25%), and Jamaican ($90,581, a difference of 0.29%).
| Demographics | Rating | Rank | Median Family Income |
| Mexican American Indians | 0.2 /100 | #267 | Tragic $90,918 |
| Cree | 0.2 /100 | #268 | Tragic $90,882 |
| Belizeans | 0.2 /100 | #269 | Tragic $90,880 |
| Jamaicans | 0.2 /100 | #270 | Tragic $90,581 |
| Iroquois | 0.2 /100 | #271 | Tragic $90,543 |
| Immigrants | Liberia | 0.2 /100 | #272 | Tragic $90,450 |
| Immigrants | Micronesia | 0.2 /100 | #273 | Tragic $90,345 |
| Spanish Americans | 0.2 /100 | #274 | Tragic $90,322 |
| Immigrants | St. Vincent and the Grenadines | 0.2 /100 | #275 | Tragic $90,094 |
| Immigrants | Zaire | 0.1 /100 | #276 | Tragic $89,285 |
| Immigrants | Jamaica | 0.1 /100 | #277 | Tragic $89,268 |
| Immigrants | Grenada | 0.1 /100 | #278 | Tragic $89,249 |
| Immigrants | Belize | 0.1 /100 | #279 | Tragic $89,197 |
| British West Indians | 0.1 /100 | #280 | Tragic $88,987 |
| Blackfeet | 0.1 /100 | #281 | Tragic $88,717 |