Armenian vs Hungarian Householder Income Ages 45 - 64 years
COMPARE
Armenian
Hungarian
Householder Income Ages 45 - 64 years
Householder Income Ages 45 - 64 years Comparison
Armenians
Hungarians
$107,002
HOUSEHOLDER INCOME AGES 45 - 64 YEARS
96.6/ 100
METRIC RATING
106th/ 347
METRIC RANK
$103,913
HOUSEHOLDER INCOME AGES 45 - 64 YEARS
85.8/ 100
METRIC RATING
137th/ 347
METRIC RANK
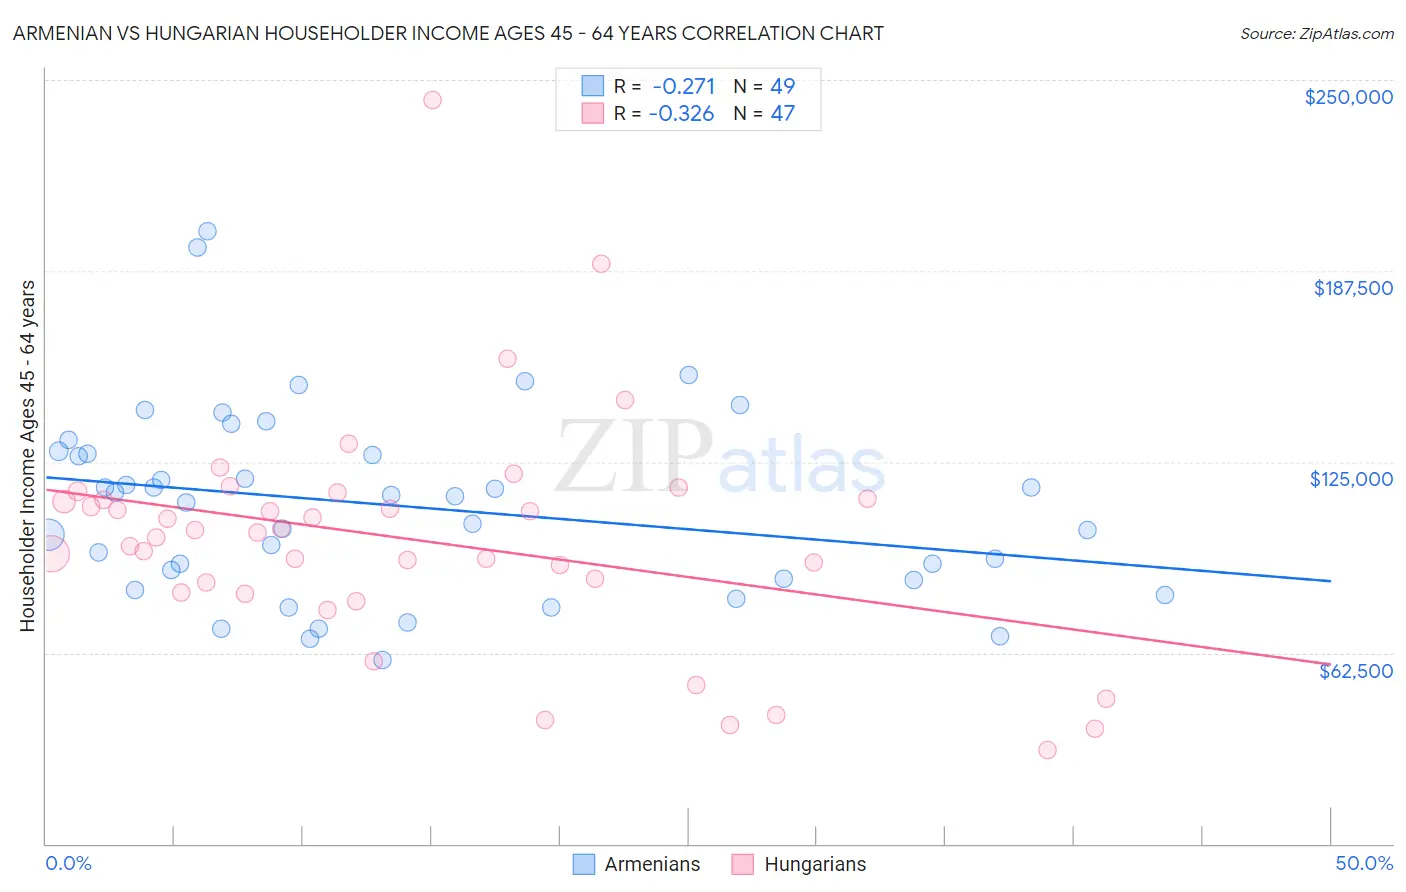
Armenian vs Hungarian Householder Income Ages 45 - 64 years Correlation Chart
The statistical analysis conducted on geographies consisting of 310,526,639 people shows a weak negative correlation between the proportion of Armenians and household income with householder between the ages 45 and 64 in the United States with a correlation coefficient (R) of -0.271 and weighted average of $107,002. Similarly, the statistical analysis conducted on geographies consisting of 484,921,050 people shows a mild negative correlation between the proportion of Hungarians and household income with householder between the ages 45 and 64 in the United States with a correlation coefficient (R) of -0.326 and weighted average of $103,913, a difference of 3.0%.
Householder Income Ages 45 - 64 years Correlation Summary
| Measurement | Armenian | Hungarian |
| Minimum | $60,000 | $30,798 |
| Maximum | $200,625 | $243,392 |
| Range | $140,625 | $212,594 |
| Mean | $110,676 | $99,450 |
| Median | $113,807 | $101,881 |
| Interquartile 25% (IQ1) | $86,427 | $82,262 |
| Interquartile 75% (IQ3) | $128,076 | $112,938 |
| Interquartile Range (IQR) | $41,649 | $30,676 |
| Standard Deviation (Sample) | $30,867 | $38,021 |
| Standard Deviation (Population) | $30,551 | $37,614 |
Similar Demographics by Householder Income Ages 45 - 64 years
Demographics Similar to Armenians by Householder Income Ages 45 - 64 years
In terms of householder income ages 45 - 64 years, the demographic groups most similar to Armenians are Immigrants from Fiji ($106,952, a difference of 0.050%), Immigrants from Ukraine ($107,079, a difference of 0.070%), Macedonian ($107,074, a difference of 0.070%), Zimbabwean ($106,849, a difference of 0.14%), and Syrian ($107,207, a difference of 0.19%).
| Demographics | Rating | Rank | Householder Income Ages 45 - 64 years |
| Palestinians | 97.6 /100 | #99 | Exceptional $107,721 |
| Immigrants | Serbia | 97.4 /100 | #100 | Exceptional $107,569 |
| Immigrants | Kazakhstan | 97.2 /100 | #101 | Exceptional $107,378 |
| Immigrants | Moldova | 97.1 /100 | #102 | Exceptional $107,357 |
| Syrians | 96.9 /100 | #103 | Exceptional $107,207 |
| Immigrants | Ukraine | 96.7 /100 | #104 | Exceptional $107,079 |
| Macedonians | 96.7 /100 | #105 | Exceptional $107,074 |
| Armenians | 96.6 /100 | #106 | Exceptional $107,002 |
| Immigrants | Fiji | 96.5 /100 | #107 | Exceptional $106,952 |
| Zimbabweans | 96.3 /100 | #108 | Exceptional $106,849 |
| Chileans | 95.9 /100 | #109 | Exceptional $106,611 |
| Immigrants | Brazil | 95.6 /100 | #110 | Exceptional $106,470 |
| Immigrants | Vietnam | 95.5 /100 | #111 | Exceptional $106,417 |
| Swedes | 95.4 /100 | #112 | Exceptional $106,377 |
| Europeans | 95.4 /100 | #113 | Exceptional $106,367 |
Demographics Similar to Hungarians by Householder Income Ages 45 - 64 years
In terms of householder income ages 45 - 64 years, the demographic groups most similar to Hungarians are Ethiopian ($103,736, a difference of 0.17%), Immigrants from Oceania ($103,705, a difference of 0.20%), Norwegian ($103,682, a difference of 0.22%), Taiwanese ($104,180, a difference of 0.26%), and Immigrants from Uganda ($103,584, a difference of 0.32%).
| Demographics | Rating | Rank | Householder Income Ages 45 - 64 years |
| Immigrants | Zimbabwe | 91.2 /100 | #130 | Exceptional $104,992 |
| Immigrants | Syria | 90.7 /100 | #131 | Exceptional $104,858 |
| Lebanese | 90.1 /100 | #132 | Exceptional $104,734 |
| Arabs | 89.3 /100 | #133 | Excellent $104,566 |
| Canadians | 89.3 /100 | #134 | Excellent $104,560 |
| Brazilians | 88.6 /100 | #135 | Excellent $104,408 |
| Taiwanese | 87.4 /100 | #136 | Excellent $104,180 |
| Hungarians | 85.8 /100 | #137 | Excellent $103,913 |
| Ethiopians | 84.7 /100 | #138 | Excellent $103,736 |
| Immigrants | Oceania | 84.5 /100 | #139 | Excellent $103,705 |
| Norwegians | 84.3 /100 | #140 | Excellent $103,682 |
| Immigrants | Uganda | 83.7 /100 | #141 | Excellent $103,584 |
| Luxembourgers | 83.3 /100 | #142 | Excellent $103,536 |
| Serbians | 83.2 /100 | #143 | Excellent $103,522 |
| Czechs | 83.1 /100 | #144 | Excellent $103,507 |