Armenian vs Immigrants from Kazakhstan Householder Income Ages 45 - 64 years
COMPARE
Armenian
Immigrants from Kazakhstan
Householder Income Ages 45 - 64 years
Householder Income Ages 45 - 64 years Comparison
Armenians
Immigrants from Kazakhstan
$107,002
HOUSEHOLDER INCOME AGES 45 - 64 YEARS
96.6/ 100
METRIC RATING
106th/ 347
METRIC RANK
$107,378
HOUSEHOLDER INCOME AGES 45 - 64 YEARS
97.2/ 100
METRIC RATING
101st/ 347
METRIC RANK
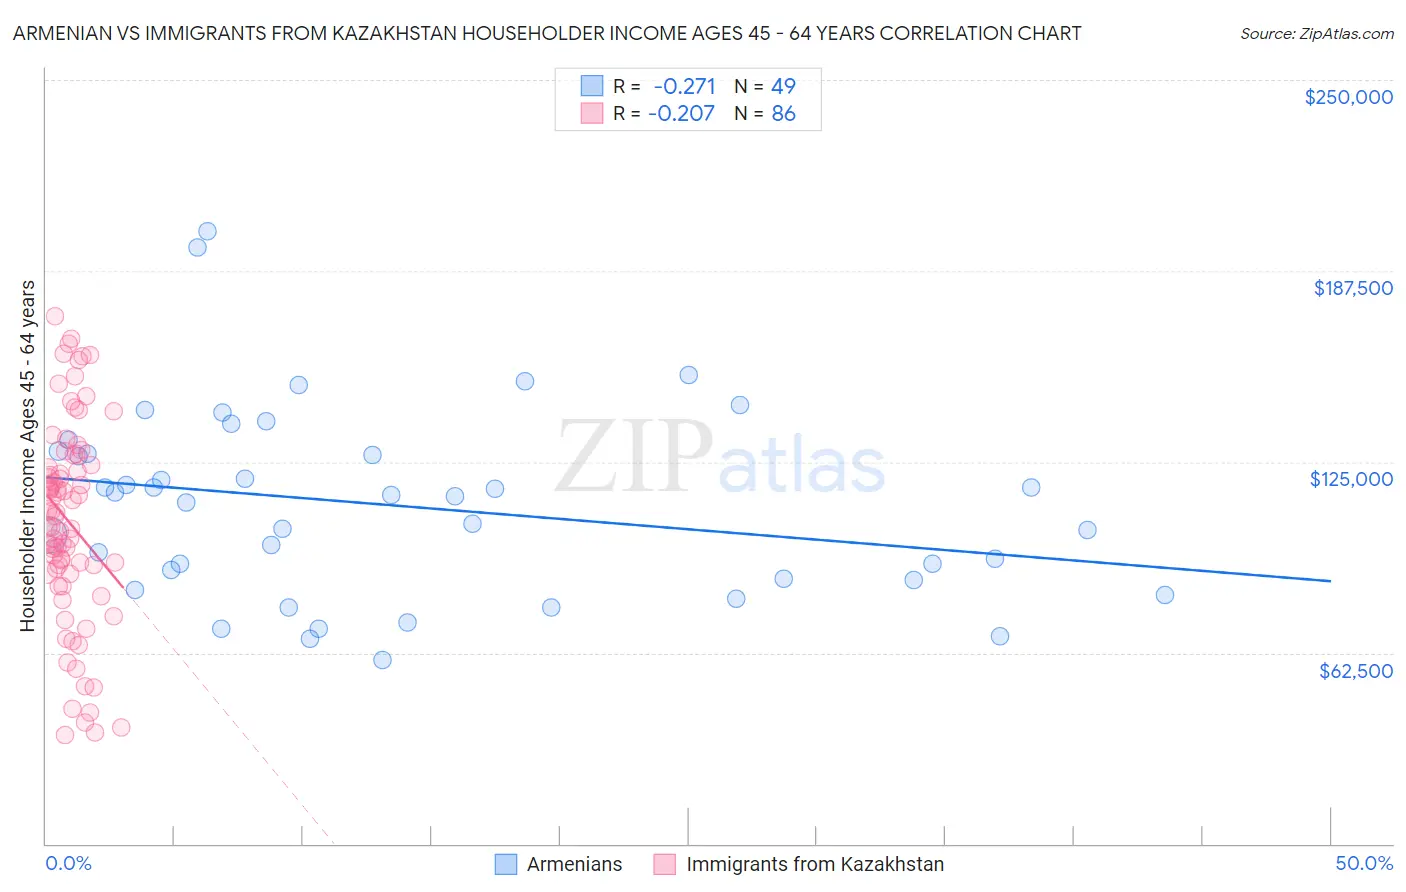
Armenian vs Immigrants from Kazakhstan Householder Income Ages 45 - 64 years Correlation Chart
The statistical analysis conducted on geographies consisting of 310,526,639 people shows a weak negative correlation between the proportion of Armenians and household income with householder between the ages 45 and 64 in the United States with a correlation coefficient (R) of -0.271 and weighted average of $107,002. Similarly, the statistical analysis conducted on geographies consisting of 124,401,740 people shows a weak negative correlation between the proportion of Immigrants from Kazakhstan and household income with householder between the ages 45 and 64 in the United States with a correlation coefficient (R) of -0.207 and weighted average of $107,378, a difference of 0.35%.
Householder Income Ages 45 - 64 years Correlation Summary
| Measurement | Armenian | Immigrants from Kazakhstan |
| Minimum | $60,000 | $35,744 |
| Maximum | $200,625 | $172,765 |
| Range | $140,625 | $137,021 |
| Mean | $110,676 | $105,299 |
| Median | $113,807 | $107,663 |
| Interquartile 25% (IQ1) | $86,427 | $88,679 |
| Interquartile 75% (IQ3) | $128,076 | $123,884 |
| Interquartile Range (IQR) | $41,649 | $35,205 |
| Standard Deviation (Sample) | $30,867 | $32,729 |
| Standard Deviation (Population) | $30,551 | $32,539 |
Demographics Similar to Armenians and Immigrants from Kazakhstan by Householder Income Ages 45 - 64 years
In terms of householder income ages 45 - 64 years, the demographic groups most similar to Armenians are Immigrants from Fiji ($106,952, a difference of 0.050%), Immigrants from Ukraine ($107,079, a difference of 0.070%), Macedonian ($107,074, a difference of 0.070%), Zimbabwean ($106,849, a difference of 0.14%), and Syrian ($107,207, a difference of 0.19%). Similarly, the demographic groups most similar to Immigrants from Kazakhstan are Immigrants from Moldova ($107,357, a difference of 0.020%), Syrian ($107,207, a difference of 0.16%), Immigrants from Serbia ($107,569, a difference of 0.18%), Immigrants from Ukraine ($107,079, a difference of 0.28%), and Macedonian ($107,074, a difference of 0.28%).
| Demographics | Rating | Rank | Householder Income Ages 45 - 64 years |
| Immigrants | Croatia | 98.2 /100 | #93 | Exceptional $108,304 |
| Sri Lankans | 98.2 /100 | #94 | Exceptional $108,270 |
| Immigrants | Hungary | 98.2 /100 | #95 | Exceptional $108,267 |
| Immigrants | Argentina | 98.2 /100 | #96 | Exceptional $108,264 |
| Northern Europeans | 97.8 /100 | #97 | Exceptional $107,870 |
| Immigrants | Southern Europe | 97.7 /100 | #98 | Exceptional $107,775 |
| Palestinians | 97.6 /100 | #99 | Exceptional $107,721 |
| Immigrants | Serbia | 97.4 /100 | #100 | Exceptional $107,569 |
| Immigrants | Kazakhstan | 97.2 /100 | #101 | Exceptional $107,378 |
| Immigrants | Moldova | 97.1 /100 | #102 | Exceptional $107,357 |
| Syrians | 96.9 /100 | #103 | Exceptional $107,207 |
| Immigrants | Ukraine | 96.7 /100 | #104 | Exceptional $107,079 |
| Macedonians | 96.7 /100 | #105 | Exceptional $107,074 |
| Armenians | 96.6 /100 | #106 | Exceptional $107,002 |
| Immigrants | Fiji | 96.5 /100 | #107 | Exceptional $106,952 |
| Zimbabweans | 96.3 /100 | #108 | Exceptional $106,849 |
| Chileans | 95.9 /100 | #109 | Exceptional $106,611 |
| Immigrants | Brazil | 95.6 /100 | #110 | Exceptional $106,470 |
| Immigrants | Vietnam | 95.5 /100 | #111 | Exceptional $106,417 |
| Swedes | 95.4 /100 | #112 | Exceptional $106,377 |
| Europeans | 95.4 /100 | #113 | Exceptional $106,367 |