Argentinean vs Spanish American Indian Median Earnings
COMPARE
Argentinean
Spanish American Indian
Median Earnings
Median Earnings Comparison
Argentineans
Spanish American Indians
$50,399
MEDIAN EARNINGS
99.6/ 100
METRIC RATING
78th/ 347
METRIC RANK
$38,907
MEDIAN EARNINGS
0.0/ 100
METRIC RATING
334th/ 347
METRIC RANK
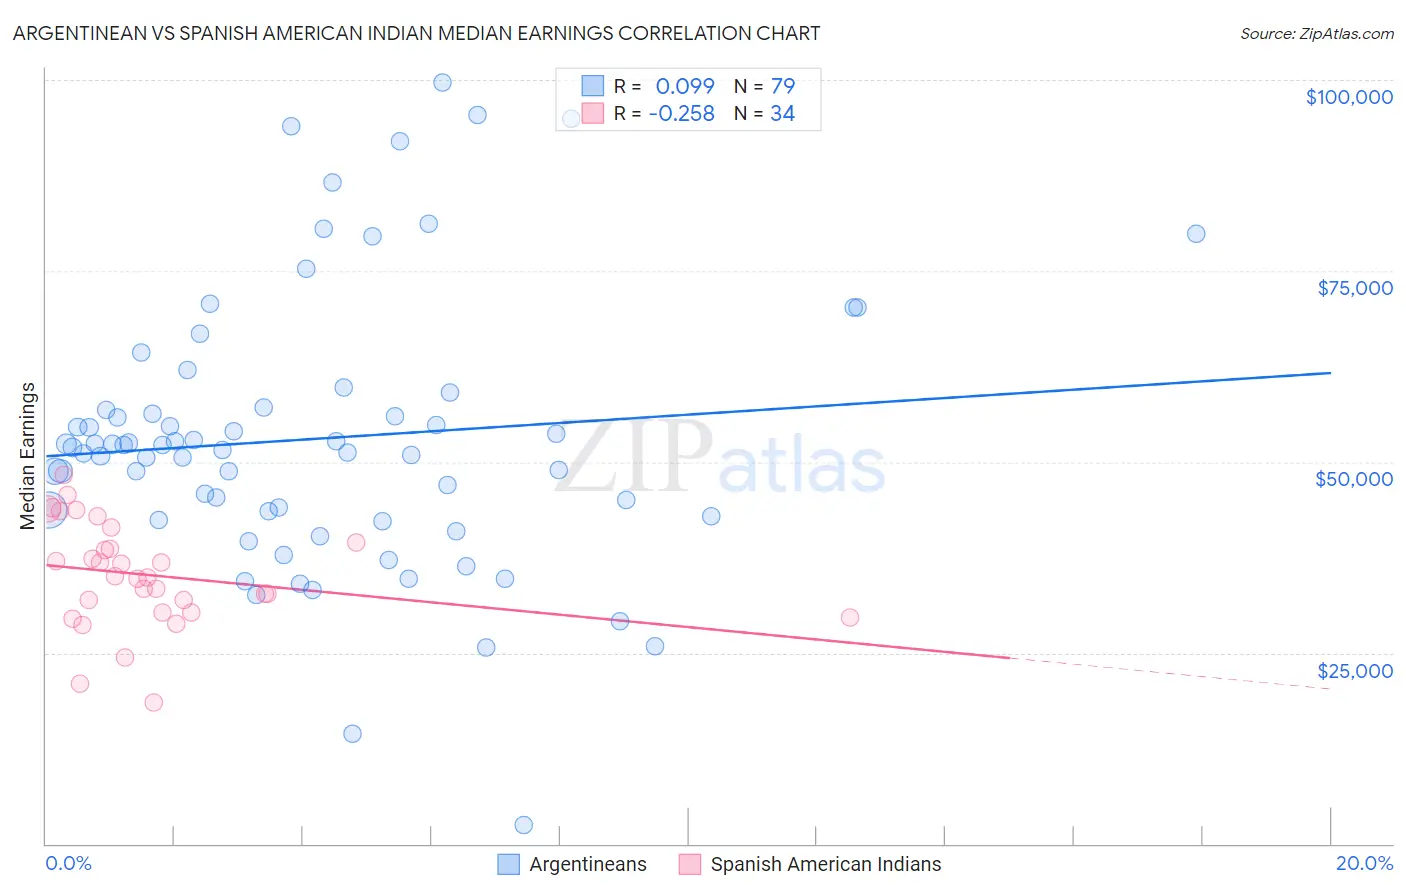
Argentinean vs Spanish American Indian Median Earnings Correlation Chart
The statistical analysis conducted on geographies consisting of 297,136,392 people shows a slight positive correlation between the proportion of Argentineans and median earnings in the United States with a correlation coefficient (R) of 0.099 and weighted average of $50,399. Similarly, the statistical analysis conducted on geographies consisting of 73,148,786 people shows a weak negative correlation between the proportion of Spanish American Indians and median earnings in the United States with a correlation coefficient (R) of -0.258 and weighted average of $38,907, a difference of 29.5%.
Median Earnings Correlation Summary
| Measurement | Argentinean | Spanish American Indian |
| Minimum | $2,499 | $18,469 |
| Maximum | $99,706 | $48,281 |
| Range | $97,207 | $29,812 |
| Mean | $53,044 | $35,173 |
| Median | $51,898 | $34,974 |
| Interquartile 25% (IQ1) | $42,917 | $30,208 |
| Interquartile 75% (IQ3) | $57,109 | $39,452 |
| Interquartile Range (IQR) | $14,192 | $9,244 |
| Standard Deviation (Sample) | $18,063 | $6,885 |
| Standard Deviation (Population) | $17,948 | $6,783 |
Similar Demographics by Median Earnings
Demographics Similar to Argentineans by Median Earnings
In terms of median earnings, the demographic groups most similar to Argentineans are Laotian ($50,343, a difference of 0.11%), Ukrainian ($50,320, a difference of 0.16%), Immigrants from Southern Europe ($50,280, a difference of 0.24%), Immigrants from Moldova ($50,274, a difference of 0.25%), and Immigrants from Western Europe ($50,549, a difference of 0.30%).
| Demographics | Rating | Rank | Median Earnings |
| Immigrants | Ukraine | 99.8 /100 | #71 | Exceptional $50,984 |
| Immigrants | Egypt | 99.8 /100 | #72 | Exceptional $50,901 |
| Immigrants | Netherlands | 99.8 /100 | #73 | Exceptional $50,818 |
| South Africans | 99.8 /100 | #74 | Exceptional $50,752 |
| Immigrants | Scotland | 99.8 /100 | #75 | Exceptional $50,741 |
| Immigrants | Italy | 99.7 /100 | #76 | Exceptional $50,581 |
| Immigrants | Western Europe | 99.7 /100 | #77 | Exceptional $50,549 |
| Argentineans | 99.6 /100 | #78 | Exceptional $50,399 |
| Laotians | 99.6 /100 | #79 | Exceptional $50,343 |
| Ukrainians | 99.6 /100 | #80 | Exceptional $50,320 |
| Immigrants | Southern Europe | 99.6 /100 | #81 | Exceptional $50,280 |
| Immigrants | Moldova | 99.5 /100 | #82 | Exceptional $50,274 |
| Romanians | 99.5 /100 | #83 | Exceptional $50,244 |
| Immigrants | Hungary | 99.5 /100 | #84 | Exceptional $50,227 |
| Immigrants | Kazakhstan | 99.5 /100 | #85 | Exceptional $50,225 |
Demographics Similar to Spanish American Indians by Median Earnings
In terms of median earnings, the demographic groups most similar to Spanish American Indians are Native/Alaskan ($38,896, a difference of 0.030%), Houma ($38,949, a difference of 0.11%), Yakama ($39,107, a difference of 0.52%), Crow ($38,707, a difference of 0.52%), and Immigrants from Mexico ($39,114, a difference of 0.53%).
| Demographics | Rating | Rank | Median Earnings |
| Yuman | 0.0 /100 | #327 | Tragic $39,523 |
| Sioux | 0.0 /100 | #328 | Tragic $39,448 |
| Kiowa | 0.0 /100 | #329 | Tragic $39,232 |
| Immigrants | Congo | 0.0 /100 | #330 | Tragic $39,169 |
| Immigrants | Mexico | 0.0 /100 | #331 | Tragic $39,114 |
| Yakama | 0.0 /100 | #332 | Tragic $39,107 |
| Houma | 0.0 /100 | #333 | Tragic $38,949 |
| Spanish American Indians | 0.0 /100 | #334 | Tragic $38,907 |
| Natives/Alaskans | 0.0 /100 | #335 | Tragic $38,896 |
| Crow | 0.0 /100 | #336 | Tragic $38,707 |
| Immigrants | Cuba | 0.0 /100 | #337 | Tragic $38,426 |
| Pima | 0.0 /100 | #338 | Tragic $38,285 |
| Menominee | 0.0 /100 | #339 | Tragic $37,884 |
| Navajo | 0.0 /100 | #340 | Tragic $36,999 |
| Lumbee | 0.0 /100 | #341 | Tragic $36,876 |