Sioux vs Immigrants from Senegal Householder Income Ages 45 - 64 years
COMPARE
Sioux
Immigrants from Senegal
Householder Income Ages 45 - 64 years
Householder Income Ages 45 - 64 years Comparison
Sioux
Immigrants from Senegal
$81,750
HOUSEHOLDER INCOME AGES 45 - 64 YEARS
0.0/ 100
METRIC RATING
322nd/ 347
METRIC RANK
$88,421
HOUSEHOLDER INCOME AGES 45 - 64 YEARS
0.3/ 100
METRIC RATING
263rd/ 347
METRIC RANK
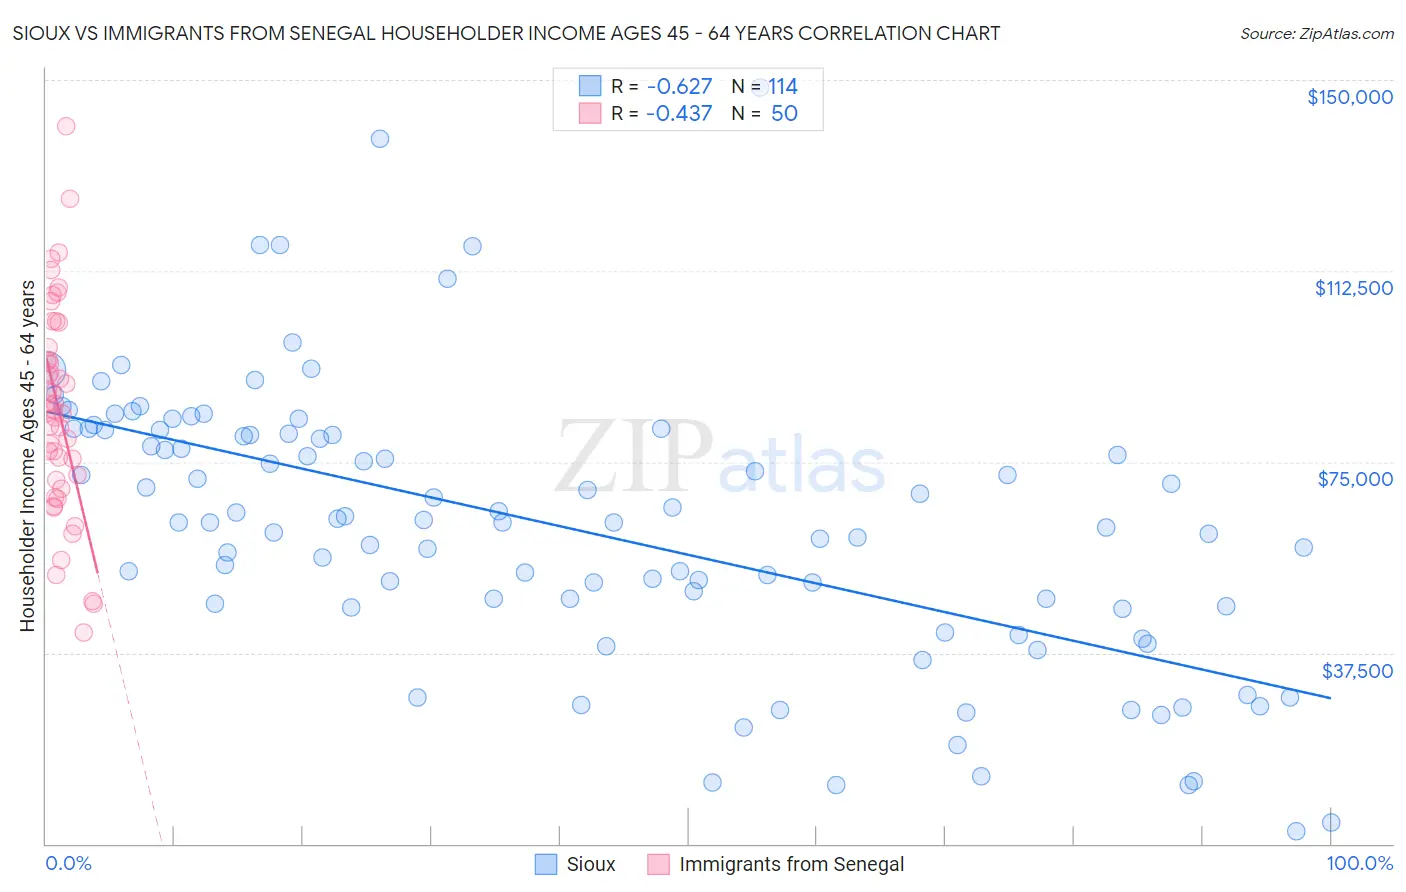
Sioux vs Immigrants from Senegal Householder Income Ages 45 - 64 years Correlation Chart
The statistical analysis conducted on geographies consisting of 233,839,839 people shows a significant negative correlation between the proportion of Sioux and household income with householder between the ages 45 and 64 in the United States with a correlation coefficient (R) of -0.627 and weighted average of $81,750. Similarly, the statistical analysis conducted on geographies consisting of 90,099,692 people shows a moderate negative correlation between the proportion of Immigrants from Senegal and household income with householder between the ages 45 and 64 in the United States with a correlation coefficient (R) of -0.437 and weighted average of $88,421, a difference of 8.2%.
Householder Income Ages 45 - 64 years Correlation Summary
| Measurement | Sioux | Immigrants from Senegal |
| Minimum | $2,499 | $41,574 |
| Maximum | $148,571 | $140,938 |
| Range | $146,072 | $99,364 |
| Mean | $62,223 | $85,290 |
| Median | $63,145 | $85,076 |
| Interquartile 25% (IQ1) | $46,523 | $71,475 |
| Interquartile 75% (IQ3) | $80,556 | $97,575 |
| Interquartile Range (IQR) | $34,033 | $26,100 |
| Standard Deviation (Sample) | $27,229 | $20,782 |
| Standard Deviation (Population) | $27,109 | $20,574 |
Similar Demographics by Householder Income Ages 45 - 64 years
Demographics Similar to Sioux by Householder Income Ages 45 - 64 years
In terms of householder income ages 45 - 64 years, the demographic groups most similar to Sioux are Bahamian ($81,369, a difference of 0.47%), Yuman ($82,139, a difference of 0.48%), Apache ($82,184, a difference of 0.53%), Chickasaw ($82,193, a difference of 0.54%), and Choctaw ($82,287, a difference of 0.66%).
| Demographics | Rating | Rank | Householder Income Ages 45 - 64 years |
| Paiute | 0.0 /100 | #315 | Tragic $82,629 |
| Immigrants | Caribbean | 0.0 /100 | #316 | Tragic $82,513 |
| Colville | 0.0 /100 | #317 | Tragic $82,474 |
| Choctaw | 0.0 /100 | #318 | Tragic $82,287 |
| Chickasaw | 0.0 /100 | #319 | Tragic $82,193 |
| Apache | 0.0 /100 | #320 | Tragic $82,184 |
| Yuman | 0.0 /100 | #321 | Tragic $82,139 |
| Sioux | 0.0 /100 | #322 | Tragic $81,750 |
| Bahamians | 0.0 /100 | #323 | Tragic $81,369 |
| Yup'ik | 0.0 /100 | #324 | Tragic $81,000 |
| Immigrants | Cuba | 0.0 /100 | #325 | Tragic $80,662 |
| Dominicans | 0.0 /100 | #326 | Tragic $80,623 |
| Seminole | 0.0 /100 | #327 | Tragic $80,077 |
| Natives/Alaskans | 0.0 /100 | #328 | Tragic $79,816 |
| Dutch West Indians | 0.0 /100 | #329 | Tragic $79,171 |
Demographics Similar to Immigrants from Senegal by Householder Income Ages 45 - 64 years
In terms of householder income ages 45 - 64 years, the demographic groups most similar to Immigrants from Senegal are Osage ($88,390, a difference of 0.040%), Jamaican ($88,327, a difference of 0.11%), Somali ($88,600, a difference of 0.20%), Immigrants from West Indies ($88,164, a difference of 0.29%), and Belizean ($88,684, a difference of 0.30%).
| Demographics | Rating | Rank | Householder Income Ages 45 - 64 years |
| French American Indians | 0.5 /100 | #256 | Tragic $89,811 |
| German Russians | 0.4 /100 | #257 | Tragic $89,398 |
| Immigrants | Barbados | 0.4 /100 | #258 | Tragic $89,394 |
| Immigrants | Nicaragua | 0.4 /100 | #259 | Tragic $89,108 |
| Liberians | 0.3 /100 | #260 | Tragic $88,929 |
| Belizeans | 0.3 /100 | #261 | Tragic $88,684 |
| Somalis | 0.3 /100 | #262 | Tragic $88,600 |
| Immigrants | Senegal | 0.3 /100 | #263 | Tragic $88,421 |
| Osage | 0.3 /100 | #264 | Tragic $88,390 |
| Jamaicans | 0.2 /100 | #265 | Tragic $88,327 |
| Immigrants | West Indies | 0.2 /100 | #266 | Tragic $88,164 |
| Hmong | 0.2 /100 | #267 | Tragic $88,115 |
| Immigrants | Micronesia | 0.2 /100 | #268 | Tragic $87,864 |
| Spanish Americans | 0.2 /100 | #269 | Tragic $87,836 |
| Immigrants | Liberia | 0.2 /100 | #270 | Tragic $87,739 |