Panamanian vs Immigrants from Senegal Householder Income Ages 45 - 64 years
COMPARE
Panamanian
Immigrants from Senegal
Householder Income Ages 45 - 64 years
Householder Income Ages 45 - 64 years Comparison
Panamanians
Immigrants from Senegal
$96,066
HOUSEHOLDER INCOME AGES 45 - 64 YEARS
10.6/ 100
METRIC RATING
214th/ 347
METRIC RANK
$88,421
HOUSEHOLDER INCOME AGES 45 - 64 YEARS
0.3/ 100
METRIC RATING
263rd/ 347
METRIC RANK
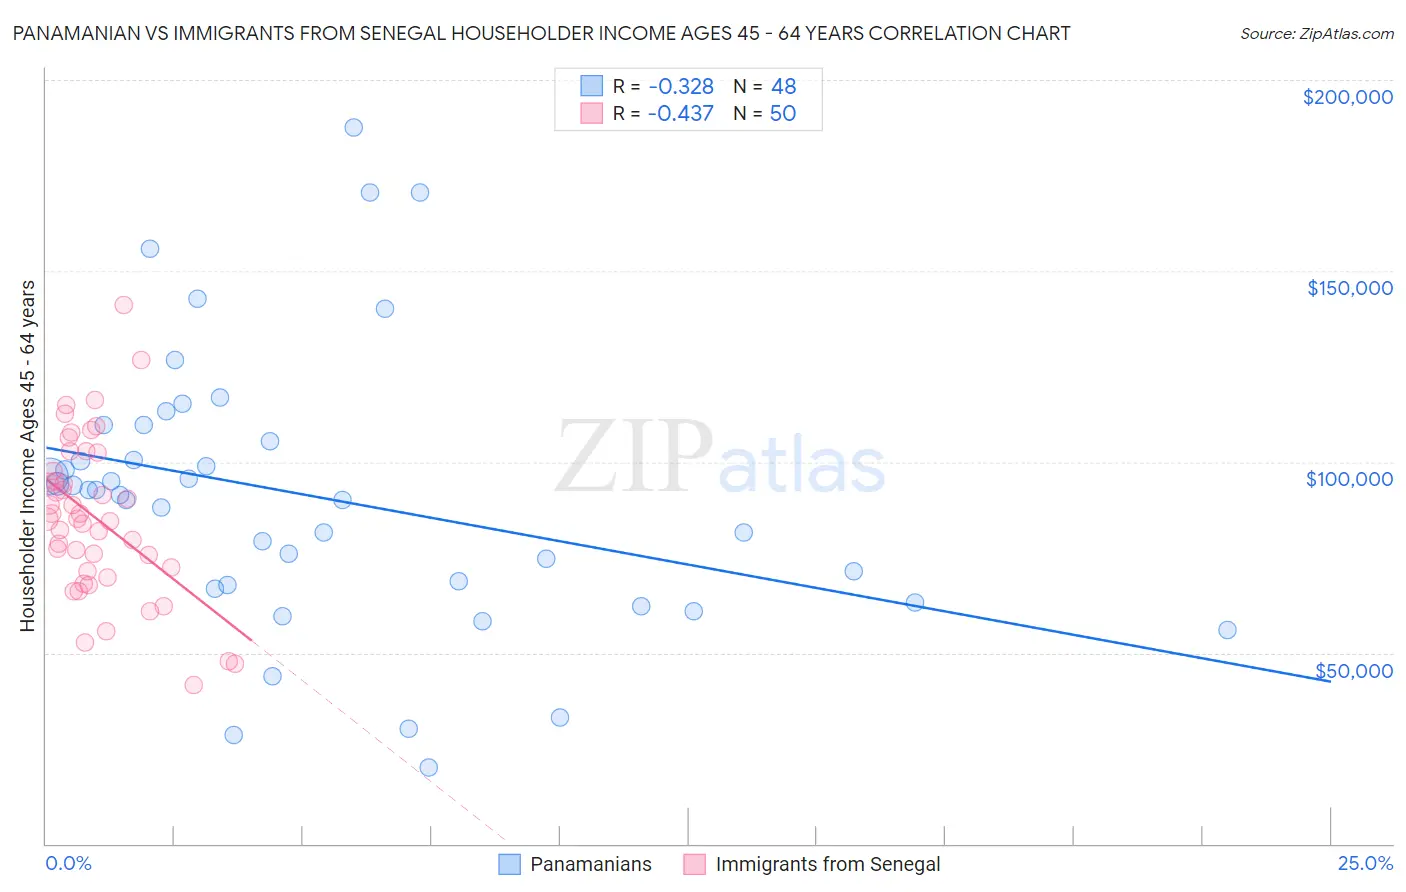
Panamanian vs Immigrants from Senegal Householder Income Ages 45 - 64 years Correlation Chart
The statistical analysis conducted on geographies consisting of 280,831,012 people shows a mild negative correlation between the proportion of Panamanians and household income with householder between the ages 45 and 64 in the United States with a correlation coefficient (R) of -0.328 and weighted average of $96,066. Similarly, the statistical analysis conducted on geographies consisting of 90,099,692 people shows a moderate negative correlation between the proportion of Immigrants from Senegal and household income with householder between the ages 45 and 64 in the United States with a correlation coefficient (R) of -0.437 and weighted average of $88,421, a difference of 8.6%.
Householder Income Ages 45 - 64 years Correlation Summary
| Measurement | Panamanian | Immigrants from Senegal |
| Minimum | $19,813 | $41,574 |
| Maximum | $187,621 | $140,938 |
| Range | $167,808 | $99,364 |
| Mean | $90,923 | $85,290 |
| Median | $91,973 | $85,076 |
| Interquartile 25% (IQ1) | $67,292 | $71,475 |
| Interquartile 75% (IQ3) | $107,469 | $97,575 |
| Interquartile Range (IQR) | $40,176 | $26,100 |
| Standard Deviation (Sample) | $36,458 | $20,782 |
| Standard Deviation (Population) | $36,077 | $20,574 |
Similar Demographics by Householder Income Ages 45 - 64 years
Demographics Similar to Panamanians by Householder Income Ages 45 - 64 years
In terms of householder income ages 45 - 64 years, the demographic groups most similar to Panamanians are Immigrants from Uruguay ($96,086, a difference of 0.020%), Venezuelan ($96,460, a difference of 0.41%), Immigrants from Cambodia ($96,537, a difference of 0.49%), Nigerian ($95,492, a difference of 0.60%), and Tsimshian ($96,783, a difference of 0.75%).
| Demographics | Rating | Rank | Householder Income Ages 45 - 64 years |
| Ghanaians | 17.9 /100 | #207 | Poor $97,277 |
| Scotch-Irish | 16.4 /100 | #208 | Poor $97,073 |
| Japanese | 14.8 /100 | #209 | Poor $96,834 |
| Tsimshian | 14.5 /100 | #210 | Poor $96,783 |
| Immigrants | Cambodia | 13.0 /100 | #211 | Poor $96,537 |
| Venezuelans | 12.6 /100 | #212 | Poor $96,460 |
| Immigrants | Uruguay | 10.7 /100 | #213 | Poor $96,086 |
| Panamanians | 10.6 /100 | #214 | Poor $96,066 |
| Nigerians | 8.2 /100 | #215 | Tragic $95,492 |
| Immigrants | Venezuela | 7.6 /100 | #216 | Tragic $95,342 |
| Immigrants | Ghana | 6.4 /100 | #217 | Tragic $94,982 |
| Delaware | 6.2 /100 | #218 | Tragic $94,914 |
| Immigrants | Armenia | 6.1 /100 | #219 | Tragic $94,863 |
| Salvadorans | 6.0 /100 | #220 | Tragic $94,842 |
| Immigrants | Nigeria | 5.9 /100 | #221 | Tragic $94,804 |
Demographics Similar to Immigrants from Senegal by Householder Income Ages 45 - 64 years
In terms of householder income ages 45 - 64 years, the demographic groups most similar to Immigrants from Senegal are Osage ($88,390, a difference of 0.040%), Jamaican ($88,327, a difference of 0.11%), Somali ($88,600, a difference of 0.20%), Immigrants from West Indies ($88,164, a difference of 0.29%), and Belizean ($88,684, a difference of 0.30%).
| Demographics | Rating | Rank | Householder Income Ages 45 - 64 years |
| French American Indians | 0.5 /100 | #256 | Tragic $89,811 |
| German Russians | 0.4 /100 | #257 | Tragic $89,398 |
| Immigrants | Barbados | 0.4 /100 | #258 | Tragic $89,394 |
| Immigrants | Nicaragua | 0.4 /100 | #259 | Tragic $89,108 |
| Liberians | 0.3 /100 | #260 | Tragic $88,929 |
| Belizeans | 0.3 /100 | #261 | Tragic $88,684 |
| Somalis | 0.3 /100 | #262 | Tragic $88,600 |
| Immigrants | Senegal | 0.3 /100 | #263 | Tragic $88,421 |
| Osage | 0.3 /100 | #264 | Tragic $88,390 |
| Jamaicans | 0.2 /100 | #265 | Tragic $88,327 |
| Immigrants | West Indies | 0.2 /100 | #266 | Tragic $88,164 |
| Hmong | 0.2 /100 | #267 | Tragic $88,115 |
| Immigrants | Micronesia | 0.2 /100 | #268 | Tragic $87,864 |
| Spanish Americans | 0.2 /100 | #269 | Tragic $87,836 |
| Immigrants | Liberia | 0.2 /100 | #270 | Tragic $87,739 |