Argentinean vs Immigrants from Croatia Householder Income Ages 45 - 64 years
COMPARE
Argentinean
Immigrants from Croatia
Householder Income Ages 45 - 64 years
Householder Income Ages 45 - 64 years Comparison
Argentineans
Immigrants from Croatia
$110,103
HOUSEHOLDER INCOME AGES 45 - 64 YEARS
99.3/ 100
METRIC RATING
73rd/ 347
METRIC RANK
$108,304
HOUSEHOLDER INCOME AGES 45 - 64 YEARS
98.2/ 100
METRIC RATING
93rd/ 347
METRIC RANK
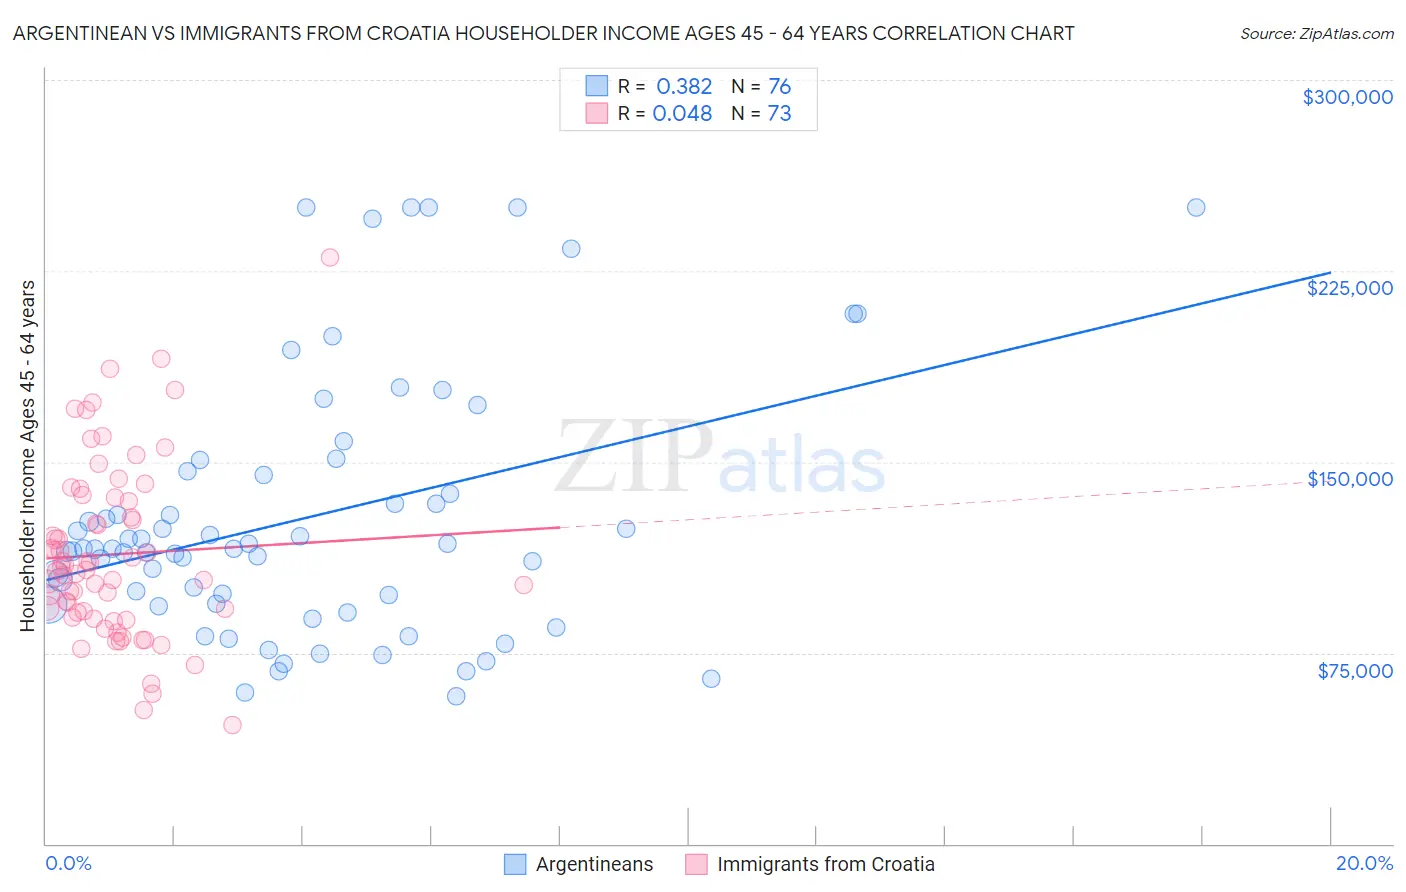
Argentinean vs Immigrants from Croatia Householder Income Ages 45 - 64 years Correlation Chart
The statistical analysis conducted on geographies consisting of 296,812,150 people shows a mild positive correlation between the proportion of Argentineans and household income with householder between the ages 45 and 64 in the United States with a correlation coefficient (R) of 0.382 and weighted average of $110,103. Similarly, the statistical analysis conducted on geographies consisting of 132,538,212 people shows no correlation between the proportion of Immigrants from Croatia and household income with householder between the ages 45 and 64 in the United States with a correlation coefficient (R) of 0.048 and weighted average of $108,304, a difference of 1.7%.
Householder Income Ages 45 - 64 years Correlation Summary
| Measurement | Argentinean | Immigrants from Croatia |
| Minimum | $57,969 | $46,667 |
| Maximum | $250,001 | $230,494 |
| Range | $192,032 | $183,827 |
| Mean | $128,288 | $113,652 |
| Median | $115,931 | $107,692 |
| Interquartile 25% (IQ1) | $94,003 | $89,990 |
| Interquartile 75% (IQ3) | $145,452 | $135,056 |
| Interquartile Range (IQR) | $51,448 | $45,066 |
| Standard Deviation (Sample) | $50,936 | $34,547 |
| Standard Deviation (Population) | $50,600 | $34,310 |
Demographics Similar to Argentineans and Immigrants from Croatia by Householder Income Ages 45 - 64 years
In terms of householder income ages 45 - 64 years, the demographic groups most similar to Argentineans are Immigrants from Egypt ($109,941, a difference of 0.15%), South African ($109,719, a difference of 0.35%), Paraguayan ($109,447, a difference of 0.60%), Immigrants from England ($109,446, a difference of 0.60%), and Immigrants from Canada ($109,402, a difference of 0.64%). Similarly, the demographic groups most similar to Immigrants from Croatia are Croatian ($108,383, a difference of 0.070%), Immigrants from Philippines ($108,471, a difference of 0.15%), Immigrants from Lebanon ($108,471, a difference of 0.15%), Ukrainian ($108,475, a difference of 0.16%), and Romanian ($108,609, a difference of 0.28%).
| Demographics | Rating | Rank | Householder Income Ages 45 - 64 years |
| Argentineans | 99.3 /100 | #73 | Exceptional $110,103 |
| Immigrants | Egypt | 99.2 /100 | #74 | Exceptional $109,941 |
| South Africans | 99.1 /100 | #75 | Exceptional $109,719 |
| Paraguayans | 99.0 /100 | #76 | Exceptional $109,447 |
| Immigrants | England | 99.0 /100 | #77 | Exceptional $109,446 |
| Immigrants | Canada | 99.0 /100 | #78 | Exceptional $109,402 |
| Immigrants | Bulgaria | 98.9 /100 | #79 | Exceptional $109,379 |
| Jordanians | 98.9 /100 | #80 | Exceptional $109,376 |
| Immigrants | Eastern Europe | 98.9 /100 | #81 | Exceptional $109,335 |
| Immigrants | North America | 98.8 /100 | #82 | Exceptional $109,198 |
| Immigrants | Spain | 98.8 /100 | #83 | Exceptional $109,051 |
| Immigrants | Western Europe | 98.6 /100 | #84 | Exceptional $108,824 |
| Immigrants | Afghanistan | 98.6 /100 | #85 | Exceptional $108,785 |
| Austrians | 98.5 /100 | #86 | Exceptional $108,692 |
| Tongans | 98.5 /100 | #87 | Exceptional $108,643 |
| Romanians | 98.5 /100 | #88 | Exceptional $108,609 |
| Ukrainians | 98.3 /100 | #89 | Exceptional $108,475 |
| Immigrants | Philippines | 98.3 /100 | #90 | Exceptional $108,471 |
| Immigrants | Lebanon | 98.3 /100 | #91 | Exceptional $108,471 |
| Croatians | 98.3 /100 | #92 | Exceptional $108,383 |
| Immigrants | Croatia | 98.2 /100 | #93 | Exceptional $108,304 |