Argentinean vs Immigrants from Northern Europe Child Poverty Under the Age of 5
COMPARE
Argentinean
Immigrants from Northern Europe
Child Poverty Under the Age of 5
Child Poverty Under the Age of 5 Comparison
Argentineans
Immigrants from Northern Europe
15.4%
CHILD POVERTY UNDER THE AGE OF 5
98.5/ 100
METRIC RATING
74th/ 347
METRIC RANK
14.8%
CHILD POVERTY UNDER THE AGE OF 5
99.6/ 100
METRIC RATING
50th/ 347
METRIC RANK
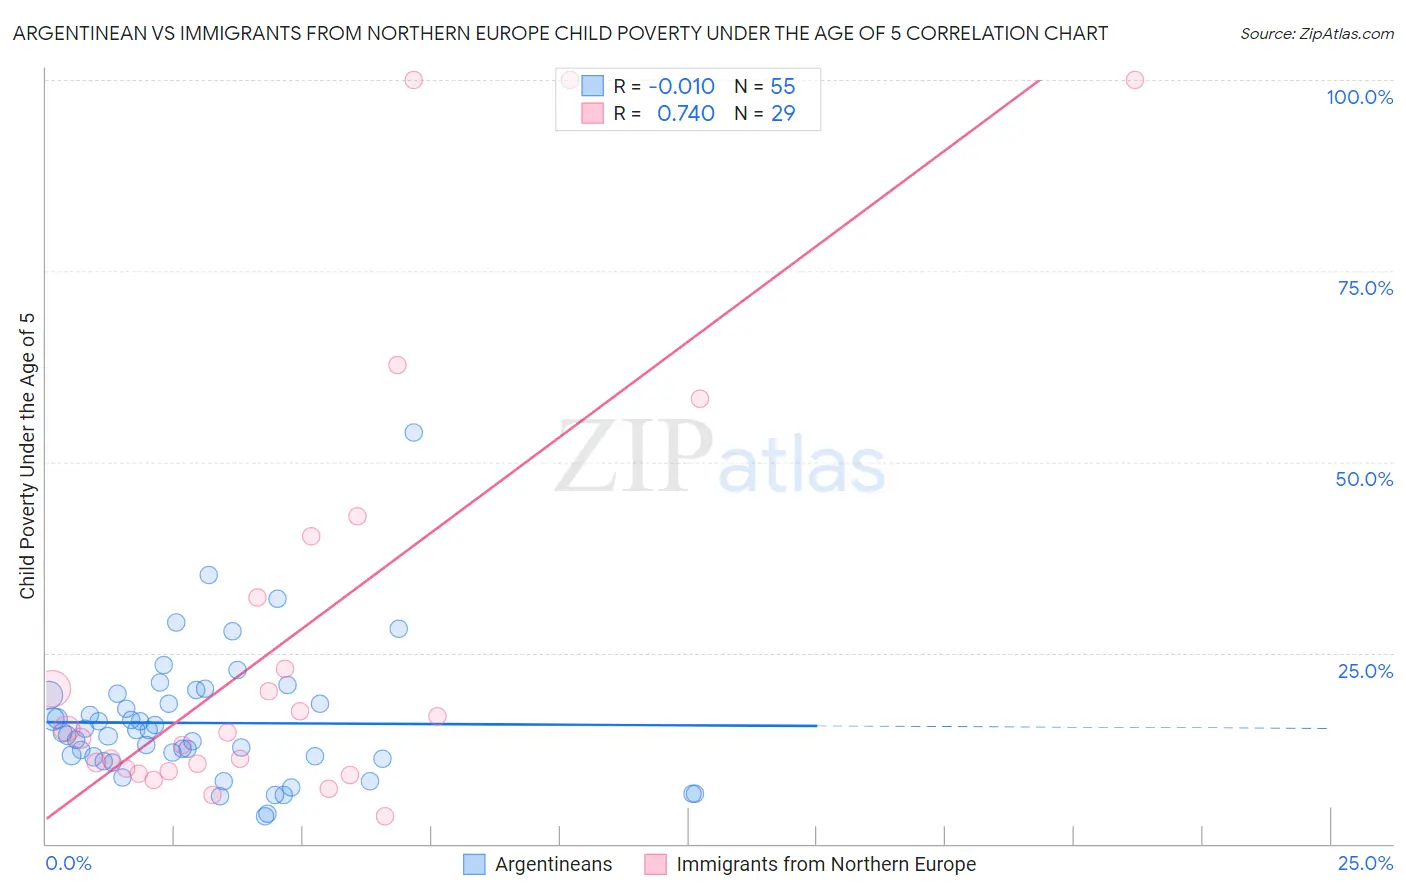
Argentinean vs Immigrants from Northern Europe Child Poverty Under the Age of 5 Correlation Chart
The statistical analysis conducted on geographies consisting of 287,138,695 people shows no correlation between the proportion of Argentineans and poverty level among children under the age of 5 in the United States with a correlation coefficient (R) of -0.010 and weighted average of 15.4%. Similarly, the statistical analysis conducted on geographies consisting of 450,553,782 people shows a strong positive correlation between the proportion of Immigrants from Northern Europe and poverty level among children under the age of 5 in the United States with a correlation coefficient (R) of 0.740 and weighted average of 14.8%, a difference of 3.7%.
Child Poverty Under the Age of 5 Correlation Summary
| Measurement | Argentinean | Immigrants from Northern Europe |
| Minimum | 3.6% | 3.6% |
| Maximum | 53.9% | 100.0% |
| Range | 50.2% | 96.4% |
| Mean | 15.8% | 27.5% |
| Median | 14.5% | 14.6% |
| Interquartile 25% (IQ1) | 11.1% | 9.7% |
| Interquartile 75% (IQ3) | 19.5% | 36.2% |
| Interquartile Range (IQR) | 8.4% | 26.6% |
| Standard Deviation (Sample) | 8.6% | 29.1% |
| Standard Deviation (Population) | 8.5% | 28.6% |
Similar Demographics by Child Poverty Under the Age of 5
Demographics Similar to Argentineans by Child Poverty Under the Age of 5
In terms of child poverty under the age of 5, the demographic groups most similar to Argentineans are Immigrants from Argentina (15.4%, a difference of 0.15%), Croatian (15.4%, a difference of 0.15%), Immigrants from Ukraine (15.3%, a difference of 0.36%), Immigrants from Turkey (15.4%, a difference of 0.36%), and Immigrants from Sweden (15.3%, a difference of 0.59%).
| Demographics | Rating | Rank | Child Poverty Under the Age of 5 |
| Greeks | 99.0 /100 | #67 | Exceptional 15.2% |
| Zimbabweans | 99.0 /100 | #68 | Exceptional 15.2% |
| Lithuanians | 99.0 /100 | #69 | Exceptional 15.2% |
| Immigrants | Belgium | 98.8 /100 | #70 | Exceptional 15.3% |
| Immigrants | Egypt | 98.8 /100 | #71 | Exceptional 15.3% |
| Immigrants | Sweden | 98.8 /100 | #72 | Exceptional 15.3% |
| Immigrants | Ukraine | 98.7 /100 | #73 | Exceptional 15.3% |
| Argentineans | 98.5 /100 | #74 | Exceptional 15.4% |
| Immigrants | Argentina | 98.5 /100 | #75 | Exceptional 15.4% |
| Croatians | 98.5 /100 | #76 | Exceptional 15.4% |
| Immigrants | Turkey | 98.3 /100 | #77 | Exceptional 15.4% |
| Sri Lankans | 98.1 /100 | #78 | Exceptional 15.5% |
| Australians | 98.0 /100 | #79 | Exceptional 15.5% |
| Italians | 97.9 /100 | #80 | Exceptional 15.5% |
| Czechs | 97.8 /100 | #81 | Exceptional 15.5% |
Demographics Similar to Immigrants from Northern Europe by Child Poverty Under the Age of 5
In terms of child poverty under the age of 5, the demographic groups most similar to Immigrants from Northern Europe are Estonian (14.8%, a difference of 0.040%), Immigrants from Bulgaria (14.8%, a difference of 0.090%), Immigrants from Czechoslovakia (14.8%, a difference of 0.24%), Russian (14.8%, a difference of 0.35%), and Tsimshian (14.7%, a difference of 0.49%).
| Demographics | Rating | Rank | Child Poverty Under the Age of 5 |
| Immigrants | Greece | 99.7 /100 | #43 | Exceptional 14.7% |
| Immigrants | Philippines | 99.7 /100 | #44 | Exceptional 14.7% |
| Laotians | 99.6 /100 | #45 | Exceptional 14.7% |
| Tsimshian | 99.6 /100 | #46 | Exceptional 14.7% |
| Russians | 99.6 /100 | #47 | Exceptional 14.8% |
| Immigrants | Czechoslovakia | 99.6 /100 | #48 | Exceptional 14.8% |
| Immigrants | Bulgaria | 99.6 /100 | #49 | Exceptional 14.8% |
| Immigrants | Northern Europe | 99.6 /100 | #50 | Exceptional 14.8% |
| Estonians | 99.6 /100 | #51 | Exceptional 14.8% |
| Immigrants | Serbia | 99.5 /100 | #52 | Exceptional 14.9% |
| Luxembourgers | 99.4 /100 | #53 | Exceptional 14.9% |
| Immigrants | Israel | 99.4 /100 | #54 | Exceptional 14.9% |
| Danes | 99.4 /100 | #55 | Exceptional 14.9% |
| Immigrants | Pakistan | 99.4 /100 | #56 | Exceptional 14.9% |
| Egyptians | 99.4 /100 | #57 | Exceptional 14.9% |