Arapaho vs Israeli Unemployment Among Youth under 25 years
COMPARE
Arapaho
Israeli
Unemployment Among Youth under 25 years
Unemployment Among Youth under 25 years Comparison
Arapaho
Israelis
16.3%
UNEMPLOYMENT AMONG YOUTH UNDER 25 YEARS
0.0/ 100
METRIC RATING
337th/ 347
METRIC RANK
12.0%
UNEMPLOYMENT AMONG YOUTH UNDER 25 YEARS
4.1/ 100
METRIC RATING
222nd/ 347
METRIC RANK
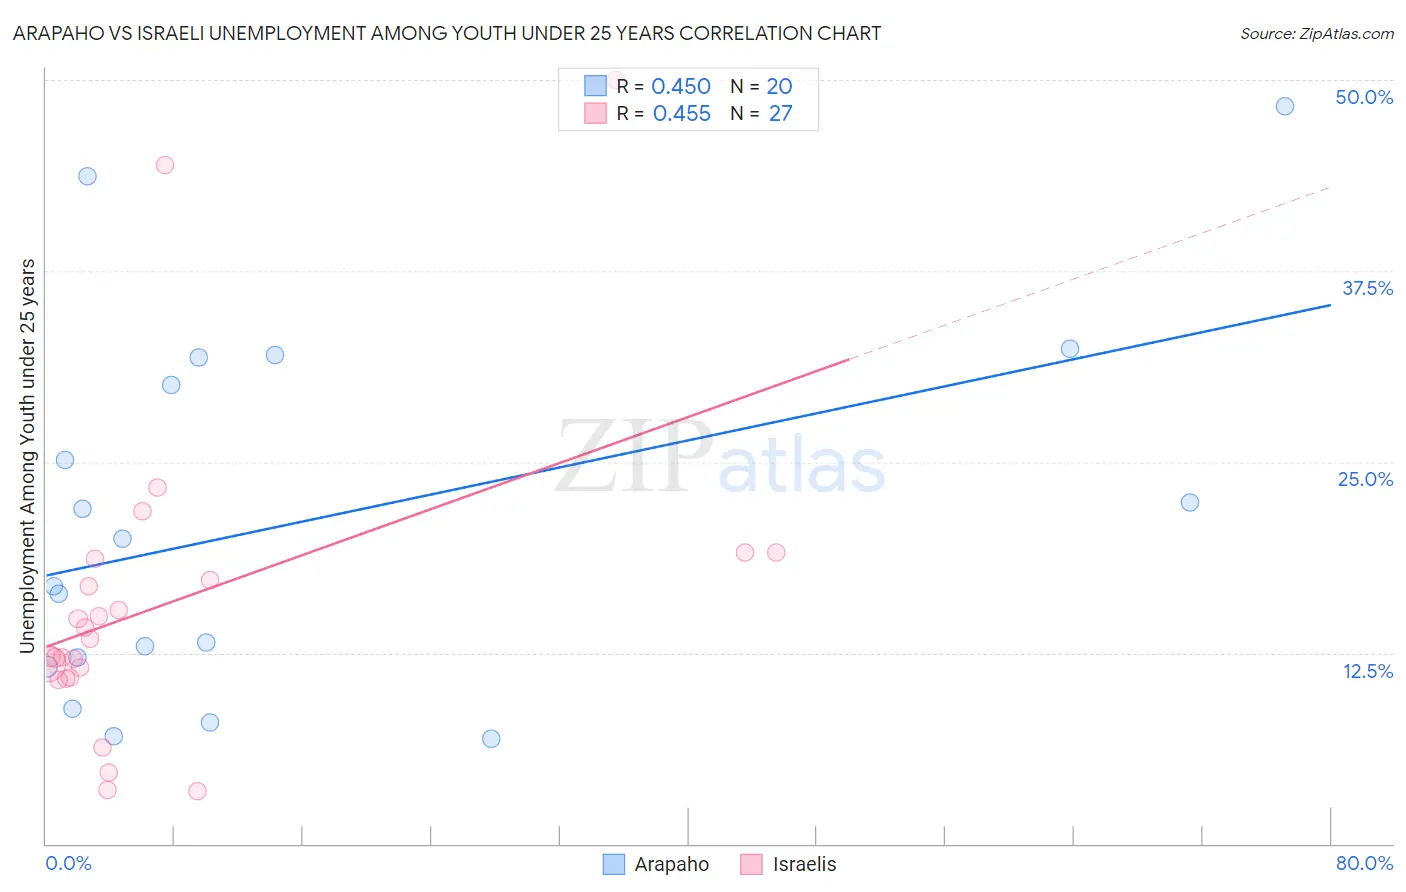
Arapaho vs Israeli Unemployment Among Youth under 25 years Correlation Chart
The statistical analysis conducted on geographies consisting of 29,675,287 people shows a moderate positive correlation between the proportion of Arapaho and unemployment rate among youth under the age of 25 in the United States with a correlation coefficient (R) of 0.450 and weighted average of 16.3%. Similarly, the statistical analysis conducted on geographies consisting of 210,036,405 people shows a moderate positive correlation between the proportion of Israelis and unemployment rate among youth under the age of 25 in the United States with a correlation coefficient (R) of 0.455 and weighted average of 12.0%, a difference of 35.8%.
Unemployment Among Youth under 25 years Correlation Summary
| Measurement | Arapaho | Israeli |
| Minimum | 6.9% | 3.4% |
| Maximum | 48.3% | 50.0% |
| Range | 41.4% | 46.6% |
| Mean | 21.1% | 15.8% |
| Median | 18.4% | 13.4% |
| Interquartile 25% (IQ1) | 11.9% | 10.8% |
| Interquartile 75% (IQ3) | 30.9% | 18.7% |
| Interquartile Range (IQR) | 19.0% | 7.8% |
| Standard Deviation (Sample) | 12.1% | 10.4% |
| Standard Deviation (Population) | 11.8% | 10.2% |
Similar Demographics by Unemployment Among Youth under 25 years
Demographics Similar to Arapaho by Unemployment Among Youth under 25 years
In terms of unemployment among youth under 25 years, the demographic groups most similar to Arapaho are Pima (16.2%, a difference of 0.16%), Yuman (16.3%, a difference of 0.30%), Immigrants from St. Vincent and the Grenadines (16.1%, a difference of 0.80%), Tsimshian (16.5%, a difference of 1.3%), and Immigrants from Guyana (15.9%, a difference of 2.1%).
| Demographics | Rating | Rank | Unemployment Among Youth under 25 years |
| Yakama | 0.0 /100 | #330 | Tragic 15.6% |
| Dominicans | 0.0 /100 | #331 | Tragic 15.7% |
| Immigrants | Grenada | 0.0 /100 | #332 | Tragic 15.8% |
| Guyanese | 0.0 /100 | #333 | Tragic 15.9% |
| Immigrants | Guyana | 0.0 /100 | #334 | Tragic 15.9% |
| Immigrants | St. Vincent and the Grenadines | 0.0 /100 | #335 | Tragic 16.1% |
| Pima | 0.0 /100 | #336 | Tragic 16.2% |
| Arapaho | 0.0 /100 | #337 | Tragic 16.3% |
| Yuman | 0.0 /100 | #338 | Tragic 16.3% |
| Tsimshian | 0.0 /100 | #339 | Tragic 16.5% |
| Colville | 0.0 /100 | #340 | Tragic 16.8% |
| Paiute | 0.0 /100 | #341 | Tragic 17.6% |
| Puerto Ricans | 0.0 /100 | #342 | Tragic 18.4% |
| Navajo | 0.0 /100 | #343 | Tragic 18.6% |
| Crow | 0.0 /100 | #344 | Tragic 20.1% |
Demographics Similar to Israelis by Unemployment Among Youth under 25 years
In terms of unemployment among youth under 25 years, the demographic groups most similar to Israelis are Immigrants from Ireland (12.0%, a difference of 0.15%), Hawaiian (12.0%, a difference of 0.15%), Immigrants from Portugal (12.0%, a difference of 0.19%), Immigrants from Ukraine (12.0%, a difference of 0.30%), and Alsatian (11.9%, a difference of 0.42%).
| Demographics | Rating | Rank | Unemployment Among Youth under 25 years |
| Samoans | 7.4 /100 | #215 | Tragic 11.9% |
| Guamanians/Chamorros | 7.0 /100 | #216 | Tragic 11.9% |
| Yaqui | 6.9 /100 | #217 | Tragic 11.9% |
| Immigrants | Middle Africa | 6.8 /100 | #218 | Tragic 11.9% |
| Immigrants | Nonimmigrants | 6.2 /100 | #219 | Tragic 11.9% |
| Alsatians | 6.1 /100 | #220 | Tragic 11.9% |
| Immigrants | Portugal | 4.9 /100 | #221 | Tragic 12.0% |
| Israelis | 4.1 /100 | #222 | Tragic 12.0% |
| Immigrants | Ireland | 3.5 /100 | #223 | Tragic 12.0% |
| Hawaiians | 3.5 /100 | #224 | Tragic 12.0% |
| Immigrants | Ukraine | 3.0 /100 | #225 | Tragic 12.0% |
| Immigrants | Israel | 2.6 /100 | #226 | Tragic 12.0% |
| Immigrants | Iran | 2.6 /100 | #227 | Tragic 12.0% |
| Immigrants | Fiji | 2.1 /100 | #228 | Tragic 12.1% |
| Moroccans | 2.1 /100 | #229 | Tragic 12.1% |