Arapaho vs Immigrants from England Median Household Income
COMPARE
Arapaho
Immigrants from England
Median Household Income
Median Household Income Comparison
Arapaho
Immigrants from England
$67,965
MEDIAN HOUSEHOLD INCOME
0.0/ 100
METRIC RATING
330th/ 347
METRIC RANK
$92,098
MEDIAN HOUSEHOLD INCOME
98.9/ 100
METRIC RATING
86th/ 347
METRIC RANK
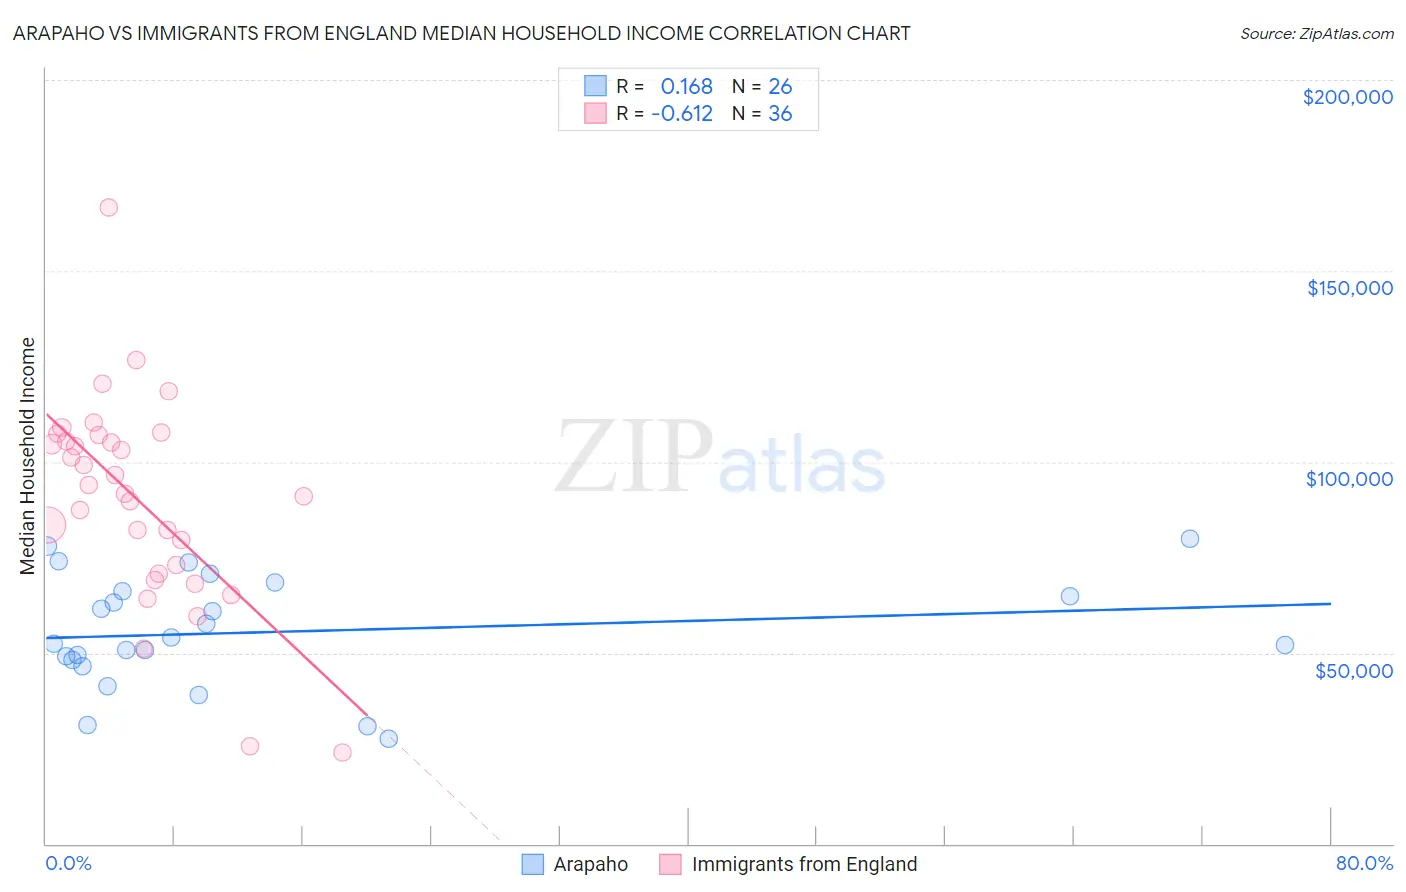
Arapaho vs Immigrants from England Median Household Income Correlation Chart
The statistical analysis conducted on geographies consisting of 29,777,139 people shows a poor positive correlation between the proportion of Arapaho and median household income in the United States with a correlation coefficient (R) of 0.168 and weighted average of $67,965. Similarly, the statistical analysis conducted on geographies consisting of 391,695,361 people shows a significant negative correlation between the proportion of Immigrants from England and median household income in the United States with a correlation coefficient (R) of -0.612 and weighted average of $92,098, a difference of 35.5%.
Median Household Income Correlation Summary
| Measurement | Arapaho | Immigrants from England |
| Minimum | $27,500 | $24,028 |
| Maximum | $80,000 | $166,753 |
| Range | $52,500 | $142,725 |
| Mean | $55,430 | $90,135 |
| Median | $53,182 | $92,873 |
| Interquartile 25% (IQ1) | $47,998 | $71,885 |
| Interquartile 75% (IQ3) | $66,111 | $106,085 |
| Interquartile Range (IQR) | $18,113 | $34,200 |
| Standard Deviation (Sample) | $14,479 | $27,284 |
| Standard Deviation (Population) | $14,198 | $26,903 |
Similar Demographics by Median Household Income
Demographics Similar to Arapaho by Median Household Income
In terms of median household income, the demographic groups most similar to Arapaho are Native/Alaskan ($67,879, a difference of 0.13%), Sioux ($67,792, a difference of 0.25%), Creek ($67,715, a difference of 0.37%), Black/African American ($67,573, a difference of 0.58%), and Dutch West Indian ($68,412, a difference of 0.66%).
| Demographics | Rating | Rank | Median Household Income |
| Bahamians | 0.0 /100 | #323 | Tragic $69,726 |
| Yup'ik | 0.0 /100 | #324 | Tragic $69,695 |
| Seminole | 0.0 /100 | #325 | Tragic $69,420 |
| Yuman | 0.0 /100 | #326 | Tragic $68,743 |
| Immigrants | Cuba | 0.0 /100 | #327 | Tragic $68,461 |
| Menominee | 0.0 /100 | #328 | Tragic $68,423 |
| Dutch West Indians | 0.0 /100 | #329 | Tragic $68,412 |
| Arapaho | 0.0 /100 | #330 | Tragic $67,965 |
| Natives/Alaskans | 0.0 /100 | #331 | Tragic $67,879 |
| Sioux | 0.0 /100 | #332 | Tragic $67,792 |
| Creek | 0.0 /100 | #333 | Tragic $67,715 |
| Blacks/African Americans | 0.0 /100 | #334 | Tragic $67,573 |
| Cheyenne | 0.0 /100 | #335 | Tragic $66,974 |
| Immigrants | Congo | 0.0 /100 | #336 | Tragic $66,768 |
| Kiowa | 0.0 /100 | #337 | Tragic $65,914 |
Demographics Similar to Immigrants from England by Median Household Income
In terms of median household income, the demographic groups most similar to Immigrants from England are Immigrants from Hungary ($92,094, a difference of 0.0%), Immigrants from Canada ($92,029, a difference of 0.080%), Romanian ($91,994, a difference of 0.11%), Assyrian/Chaldean/Syriac ($91,991, a difference of 0.12%), and Immigrants from Vietnam ($91,987, a difference of 0.12%).
| Demographics | Rating | Rank | Median Household Income |
| Sri Lankans | 99.4 /100 | #79 | Exceptional $93,093 |
| Tongans | 99.4 /100 | #80 | Exceptional $93,076 |
| Immigrants | Eastern Europe | 99.4 /100 | #81 | Exceptional $93,051 |
| Immigrants | Spain | 99.3 /100 | #82 | Exceptional $92,732 |
| Italians | 99.1 /100 | #83 | Exceptional $92,475 |
| Immigrants | Argentina | 99.1 /100 | #84 | Exceptional $92,417 |
| Immigrants | Croatia | 99.0 /100 | #85 | Exceptional $92,225 |
| Immigrants | England | 98.9 /100 | #86 | Exceptional $92,098 |
| Immigrants | Hungary | 98.9 /100 | #87 | Exceptional $92,094 |
| Immigrants | Canada | 98.8 /100 | #88 | Exceptional $92,029 |
| Romanians | 98.8 /100 | #89 | Exceptional $91,994 |
| Assyrians/Chaldeans/Syriacs | 98.8 /100 | #90 | Exceptional $91,991 |
| Immigrants | Vietnam | 98.8 /100 | #91 | Exceptional $91,987 |
| Immigrants | Western Europe | 98.8 /100 | #92 | Exceptional $91,936 |
| Immigrants | Lebanon | 98.7 /100 | #93 | Exceptional $91,887 |