Arapaho vs Colville Median Earnings
COMPARE
Arapaho
Colville
Median Earnings
Median Earnings Comparison
Arapaho
Colville
$36,586
MEDIAN EARNINGS
0.0/ 100
METRIC RATING
344th/ 347
METRIC RANK
$42,151
MEDIAN EARNINGS
0.2/ 100
METRIC RATING
279th/ 347
METRIC RANK
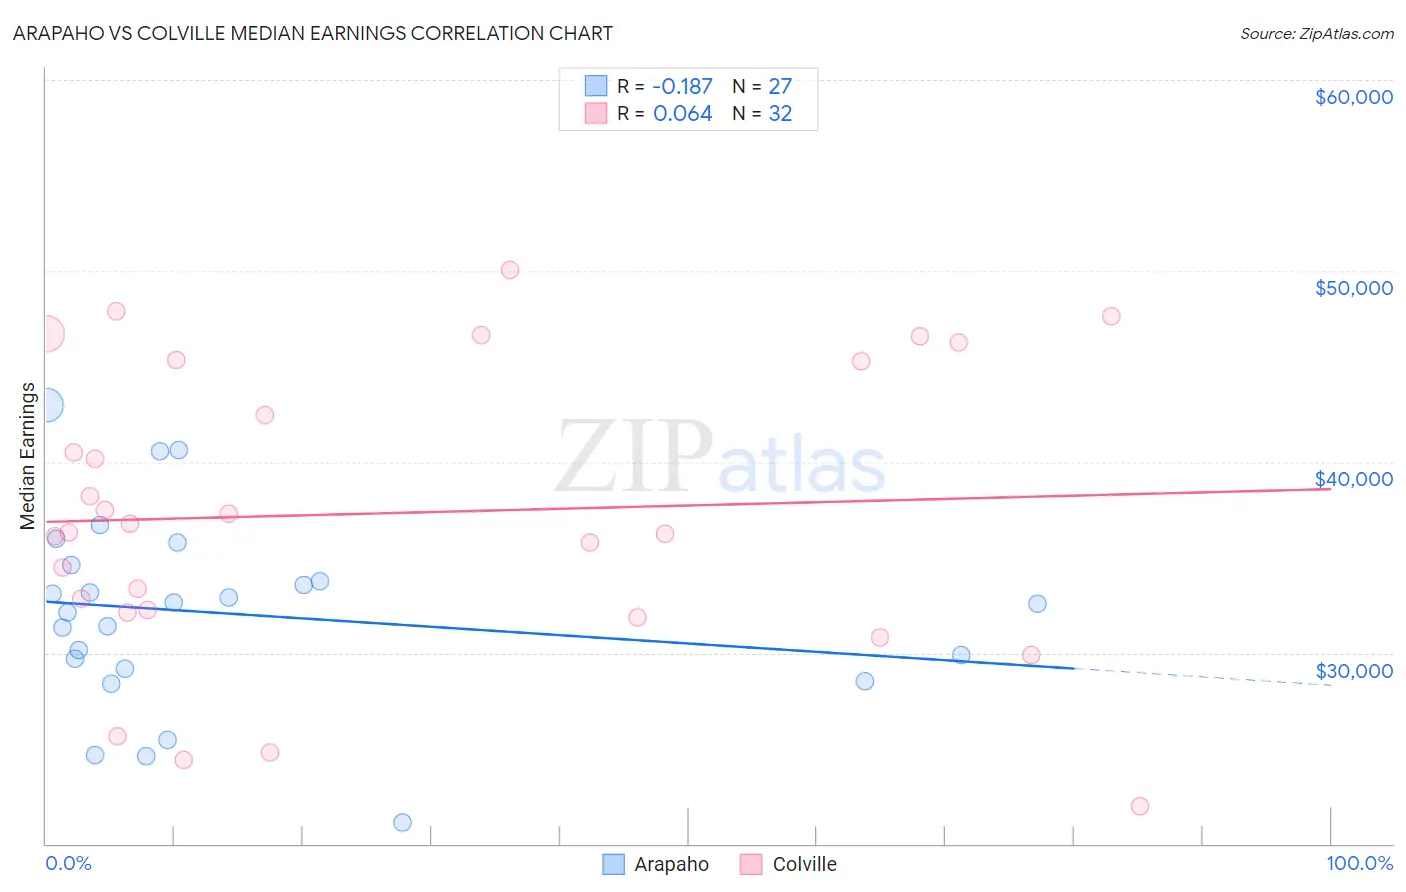
Arapaho vs Colville Median Earnings Correlation Chart
The statistical analysis conducted on geographies consisting of 29,778,965 people shows a poor negative correlation between the proportion of Arapaho and median earnings in the United States with a correlation coefficient (R) of -0.187 and weighted average of $36,586. Similarly, the statistical analysis conducted on geographies consisting of 34,684,676 people shows a slight positive correlation between the proportion of Colville and median earnings in the United States with a correlation coefficient (R) of 0.064 and weighted average of $42,151, a difference of 15.2%.
Median Earnings Correlation Summary
| Measurement | Arapaho | Colville |
| Minimum | $21,094 | $21,944 |
| Maximum | $42,957 | $50,045 |
| Range | $21,863 | $28,101 |
| Mean | $32,041 | $37,312 |
| Median | $32,563 | $36,531 |
| Interquartile 25% (IQ1) | $29,178 | $32,193 |
| Interquartile 75% (IQ3) | $34,586 | $45,323 |
| Interquartile Range (IQR) | $5,408 | $13,130 |
| Standard Deviation (Sample) | $5,015 | $7,666 |
| Standard Deviation (Population) | $4,921 | $7,545 |
Similar Demographics by Median Earnings
Demographics Similar to Arapaho by Median Earnings
In terms of median earnings, the demographic groups most similar to Arapaho are Tohono O'odham ($36,349, a difference of 0.65%), Pueblo ($36,859, a difference of 0.75%), Hopi ($36,871, a difference of 0.78%), Lumbee ($36,876, a difference of 0.79%), and Navajo ($36,999, a difference of 1.1%).
| Demographics | Rating | Rank | Median Earnings |
| Houma | 0.0 /100 | #333 | Tragic $38,949 |
| Spanish American Indians | 0.0 /100 | #334 | Tragic $38,907 |
| Natives/Alaskans | 0.0 /100 | #335 | Tragic $38,896 |
| Crow | 0.0 /100 | #336 | Tragic $38,707 |
| Immigrants | Cuba | 0.0 /100 | #337 | Tragic $38,426 |
| Pima | 0.0 /100 | #338 | Tragic $38,285 |
| Menominee | 0.0 /100 | #339 | Tragic $37,884 |
| Navajo | 0.0 /100 | #340 | Tragic $36,999 |
| Lumbee | 0.0 /100 | #341 | Tragic $36,876 |
| Hopi | 0.0 /100 | #342 | Tragic $36,871 |
| Pueblo | 0.0 /100 | #343 | Tragic $36,859 |
| Arapaho | 0.0 /100 | #344 | Tragic $36,586 |
| Tohono O'odham | 0.0 /100 | #345 | Tragic $36,349 |
| Yup'ik | 0.0 /100 | #346 | Tragic $35,942 |
| Puerto Ricans | 0.0 /100 | #347 | Tragic $35,560 |
Demographics Similar to Colville by Median Earnings
In terms of median earnings, the demographic groups most similar to Colville are Cajun ($42,189, a difference of 0.090%), Hmong ($42,111, a difference of 0.10%), Central American ($42,280, a difference of 0.31%), Spanish American ($42,316, a difference of 0.39%), and Marshallese ($41,969, a difference of 0.43%).
| Demographics | Rating | Rank | Median Earnings |
| Iroquois | 0.4 /100 | #272 | Tragic $42,430 |
| Immigrants | Dominica | 0.4 /100 | #273 | Tragic $42,420 |
| Immigrants | El Salvador | 0.4 /100 | #274 | Tragic $42,413 |
| Immigrants | Belize | 0.3 /100 | #275 | Tragic $42,339 |
| Spanish Americans | 0.3 /100 | #276 | Tragic $42,316 |
| Central Americans | 0.3 /100 | #277 | Tragic $42,280 |
| Cajuns | 0.3 /100 | #278 | Tragic $42,189 |
| Colville | 0.2 /100 | #279 | Tragic $42,151 |
| Hmong | 0.2 /100 | #280 | Tragic $42,111 |
| Marshallese | 0.2 /100 | #281 | Tragic $41,969 |
| Africans | 0.2 /100 | #282 | Tragic $41,955 |
| Dominicans | 0.2 /100 | #283 | Tragic $41,864 |
| Blackfeet | 0.2 /100 | #284 | Tragic $41,822 |
| Immigrants | Nicaragua | 0.1 /100 | #285 | Tragic $41,737 |
| Mexican American Indians | 0.1 /100 | #286 | Tragic $41,719 |