Arapaho vs Bermudan Doctorate Degree
COMPARE
Arapaho
Bermudan
Doctorate Degree
Doctorate Degree Comparison
Arapaho
Bermudans
1.2%
DOCTORATE DEGREE
0.0/ 100
METRIC RATING
342nd/ 347
METRIC RANK
1.8%
DOCTORATE DEGREE
52.1/ 100
METRIC RATING
171st/ 347
METRIC RANK
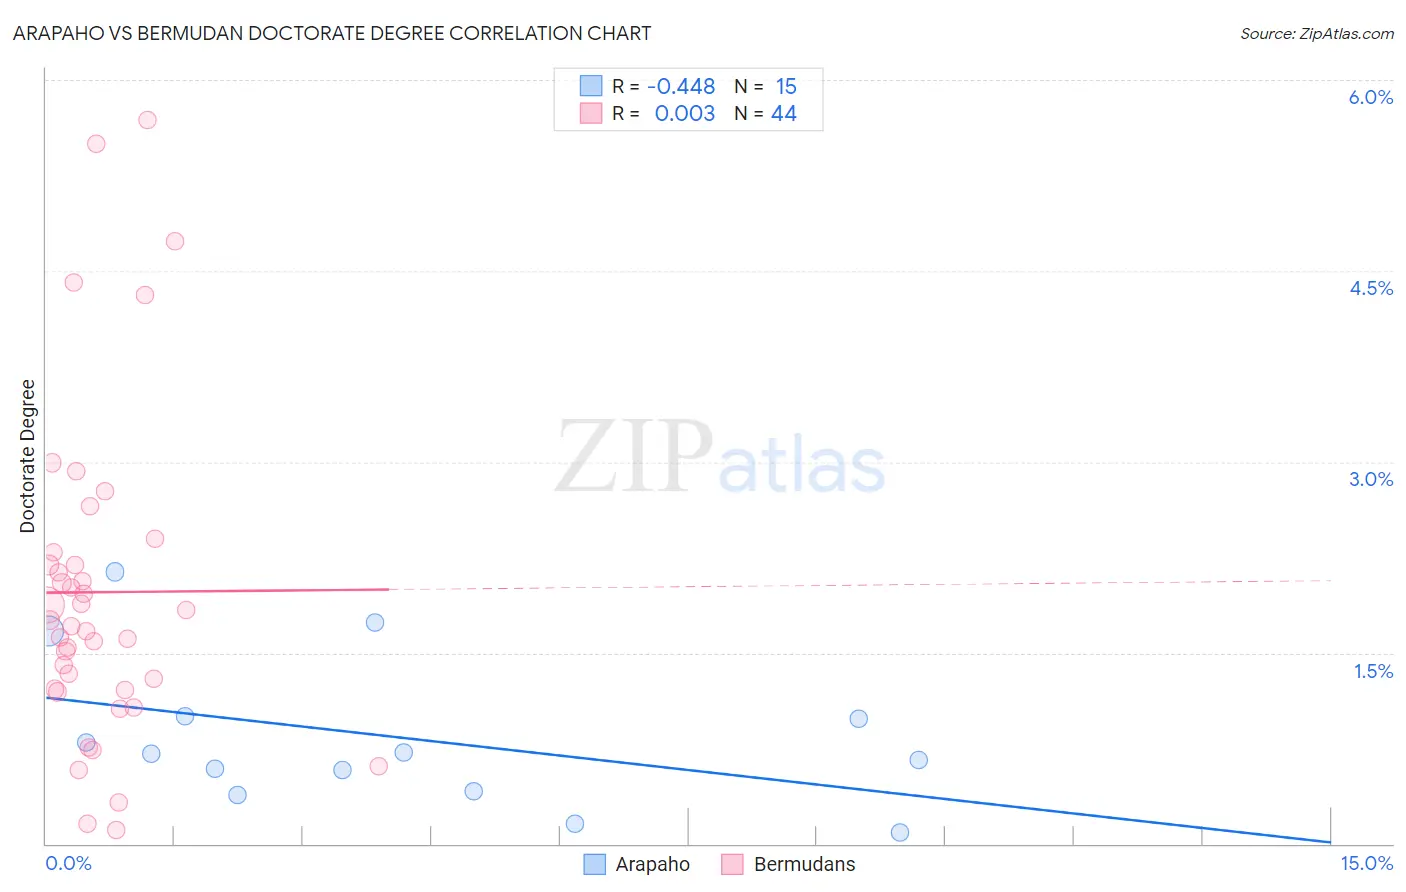
Arapaho vs Bermudan Doctorate Degree Correlation Chart
The statistical analysis conducted on geographies consisting of 29,522,759 people shows a moderate negative correlation between the proportion of Arapaho and percentage of population with at least doctorate degree education in the United States with a correlation coefficient (R) of -0.448 and weighted average of 1.2%. Similarly, the statistical analysis conducted on geographies consisting of 55,683,142 people shows no correlation between the proportion of Bermudans and percentage of population with at least doctorate degree education in the United States with a correlation coefficient (R) of 0.003 and weighted average of 1.8%, a difference of 58.1%.
Doctorate Degree Correlation Summary
| Measurement | Arapaho | Bermudan |
| Minimum | 0.090% | 0.10% |
| Maximum | 2.1% | 5.7% |
| Range | 2.0% | 5.6% |
| Mean | 0.84% | 2.0% |
| Median | 0.71% | 1.7% |
| Interquartile 25% (IQ1) | 0.41% | 1.2% |
| Interquartile 75% (IQ3) | 1.0% | 2.2% |
| Interquartile Range (IQR) | 0.59% | 1.0% |
| Standard Deviation (Sample) | 0.59% | 1.3% |
| Standard Deviation (Population) | 0.57% | 1.3% |
Similar Demographics by Doctorate Degree
Demographics Similar to Arapaho by Doctorate Degree
In terms of doctorate degree, the demographic groups most similar to Arapaho are Mexican (1.2%, a difference of 0.38%), Immigrants from Cuba (1.2%, a difference of 0.86%), Immigrants from Central America (1.2%, a difference of 1.7%), Puget Sound Salish (1.2%, a difference of 3.0%), and Fijian (1.1%, a difference of 3.4%).
| Demographics | Rating | Rank | Doctorate Degree |
| Immigrants | Caribbean | 0.0 /100 | #333 | Tragic 1.3% |
| Immigrants | Dominican Republic | 0.0 /100 | #334 | Tragic 1.3% |
| Immigrants | Haiti | 0.0 /100 | #335 | Tragic 1.3% |
| Nepalese | 0.0 /100 | #336 | Tragic 1.3% |
| Bangladeshis | 0.0 /100 | #337 | Tragic 1.2% |
| Puget Sound Salish | 0.0 /100 | #338 | Tragic 1.2% |
| Immigrants | Central America | 0.0 /100 | #339 | Tragic 1.2% |
| Immigrants | Cuba | 0.0 /100 | #340 | Tragic 1.2% |
| Mexicans | 0.0 /100 | #341 | Tragic 1.2% |
| Arapaho | 0.0 /100 | #342 | Tragic 1.2% |
| Fijians | 0.0 /100 | #343 | Tragic 1.1% |
| Immigrants | Mexico | 0.0 /100 | #344 | Tragic 1.1% |
| Lumbee | 0.0 /100 | #345 | Tragic 1.1% |
| Spanish American Indians | 0.0 /100 | #346 | Tragic 1.1% |
| Houma | 0.0 /100 | #347 | Tragic 0.96% |
Demographics Similar to Bermudans by Doctorate Degree
In terms of doctorate degree, the demographic groups most similar to Bermudans are Costa Rican (1.8%, a difference of 0.17%), Belgian (1.8%, a difference of 0.27%), Norwegian (1.8%, a difference of 0.31%), Immigrants from Bangladesh (1.8%, a difference of 0.31%), and Vietnamese (1.9%, a difference of 0.39%).
| Demographics | Rating | Rank | Doctorate Degree |
| Celtics | 66.7 /100 | #164 | Good 1.9% |
| Scotch-Irish | 63.6 /100 | #165 | Good 1.9% |
| Spaniards | 63.5 /100 | #166 | Good 1.9% |
| Macedonians | 60.9 /100 | #167 | Good 1.9% |
| Sri Lankans | 60.3 /100 | #168 | Good 1.9% |
| Vietnamese | 54.8 /100 | #169 | Average 1.9% |
| Costa Ricans | 53.3 /100 | #170 | Average 1.8% |
| Bermudans | 52.1 /100 | #171 | Average 1.8% |
| Belgians | 50.3 /100 | #172 | Average 1.8% |
| Norwegians | 50.0 /100 | #173 | Average 1.8% |
| Immigrants | Bangladesh | 50.0 /100 | #174 | Average 1.8% |
| Immigrants | Thailand | 49.4 /100 | #175 | Average 1.8% |
| Spanish | 49.3 /100 | #176 | Average 1.8% |
| Iraqis | 49.2 /100 | #177 | Average 1.8% |
| French | 48.8 /100 | #178 | Average 1.8% |