German vs Apache Median Family Income
COMPARE
German
Apache
Median Family Income
Median Family Income Comparison
Germans
Apache
$102,254
MEDIAN FAMILY INCOME
44.6/ 100
METRIC RATING
177th/ 347
METRIC RANK
$84,451
MEDIAN FAMILY INCOME
0.0/ 100
METRIC RATING
315th/ 347
METRIC RANK
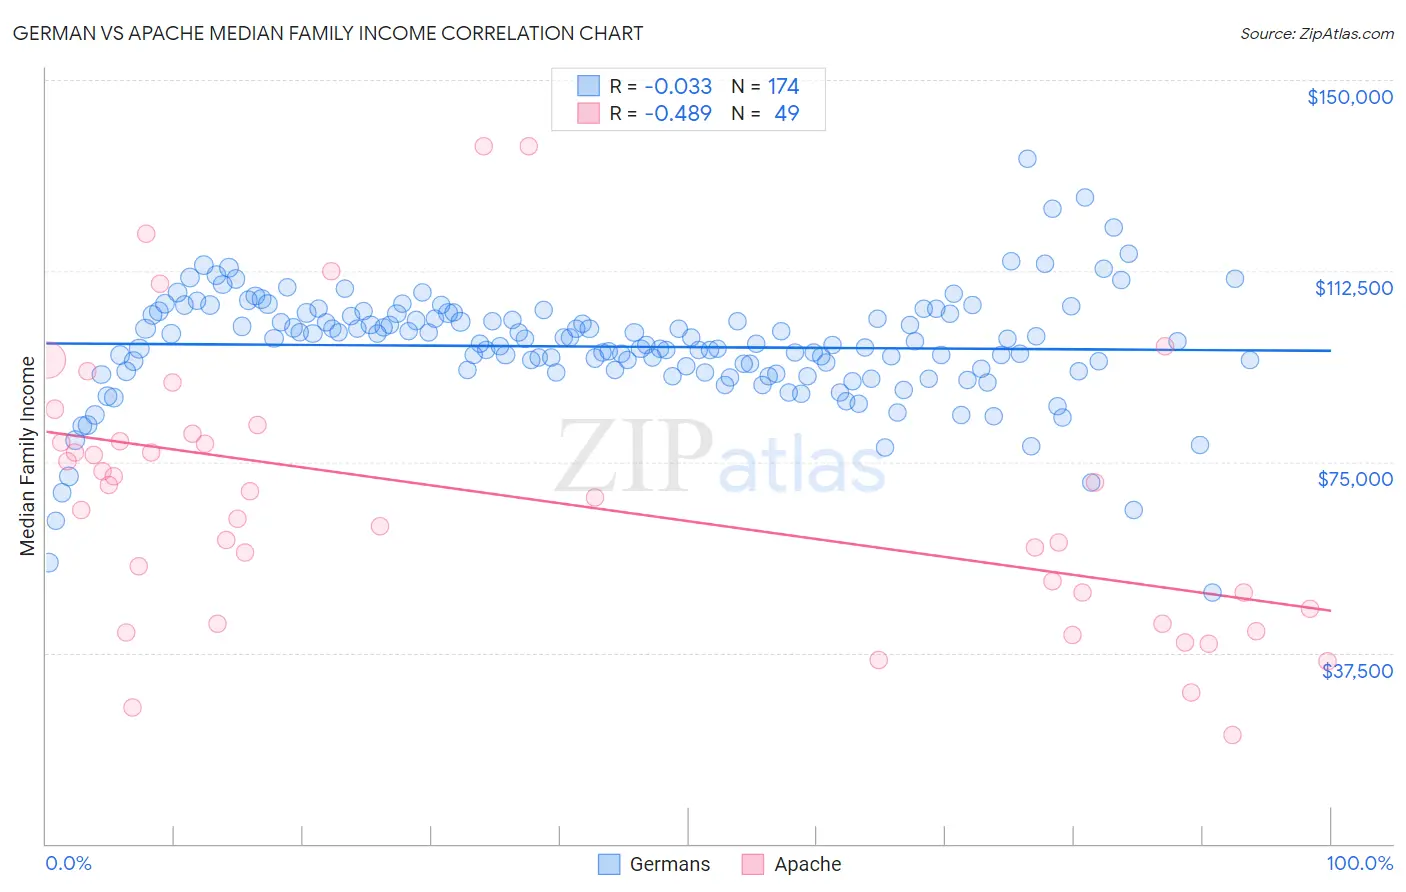
German vs Apache Median Family Income Correlation Chart
The statistical analysis conducted on geographies consisting of 579,235,453 people shows no correlation between the proportion of Germans and median family income in the United States with a correlation coefficient (R) of -0.033 and weighted average of $102,254. Similarly, the statistical analysis conducted on geographies consisting of 231,007,077 people shows a moderate negative correlation between the proportion of Apache and median family income in the United States with a correlation coefficient (R) of -0.489 and weighted average of $84,451, a difference of 21.1%.
Median Family Income Correlation Summary
| Measurement | German | Apache |
| Minimum | $49,444 | $21,444 |
| Maximum | $134,628 | $136,944 |
| Range | $85,184 | $115,500 |
| Mean | $97,641 | $67,810 |
| Median | $98,482 | $68,015 |
| Interquartile 25% (IQ1) | $92,833 | $44,680 |
| Interquartile 75% (IQ3) | $104,084 | $79,729 |
| Interquartile Range (IQR) | $11,251 | $35,049 |
| Standard Deviation (Sample) | $11,245 | $26,784 |
| Standard Deviation (Population) | $11,212 | $26,510 |
Similar Demographics by Median Family Income
Demographics Similar to Germans by Median Family Income
In terms of median family income, the demographic groups most similar to Germans are Welsh ($102,151, a difference of 0.10%), French ($102,368, a difference of 0.11%), Immigrants from Eastern Africa ($102,451, a difference of 0.19%), South American ($101,856, a difference of 0.39%), and Finnish ($102,676, a difference of 0.41%).
| Demographics | Rating | Rank | Median Family Income |
| Immigrants | Uzbekistan | 56.6 /100 | #170 | Average $103,197 |
| Alsatians | 54.3 /100 | #171 | Average $103,010 |
| Immigrants | Eritrea | 51.9 /100 | #172 | Average $102,823 |
| Belgians | 51.4 /100 | #173 | Average $102,788 |
| Finns | 50.0 /100 | #174 | Average $102,676 |
| Immigrants | Eastern Africa | 47.1 /100 | #175 | Average $102,451 |
| French | 46.1 /100 | #176 | Average $102,368 |
| Germans | 44.6 /100 | #177 | Average $102,254 |
| Welsh | 43.3 /100 | #178 | Average $102,151 |
| South Americans | 39.7 /100 | #179 | Fair $101,856 |
| French Canadians | 37.0 /100 | #180 | Fair $101,634 |
| Spaniards | 36.8 /100 | #181 | Fair $101,617 |
| Tsimshian | 35.9 /100 | #182 | Fair $101,543 |
| Kenyans | 34.5 /100 | #183 | Fair $101,417 |
| Immigrants | Costa Rica | 33.7 /100 | #184 | Fair $101,354 |
Demographics Similar to Apache by Median Family Income
In terms of median family income, the demographic groups most similar to Apache are Immigrants from Bahamas ($84,732, a difference of 0.33%), Choctaw ($84,835, a difference of 0.45%), Immigrants from Haiti ($84,018, a difference of 0.52%), Yakama ($83,932, a difference of 0.62%), and Cuban ($84,981, a difference of 0.63%).
| Demographics | Rating | Rank | Median Family Income |
| U.S. Virgin Islanders | 0.0 /100 | #308 | Tragic $85,294 |
| Haitians | 0.0 /100 | #309 | Tragic $85,218 |
| Immigrants | Central America | 0.0 /100 | #310 | Tragic $85,050 |
| Hondurans | 0.0 /100 | #311 | Tragic $85,004 |
| Cubans | 0.0 /100 | #312 | Tragic $84,981 |
| Choctaw | 0.0 /100 | #313 | Tragic $84,835 |
| Immigrants | Bahamas | 0.0 /100 | #314 | Tragic $84,732 |
| Apache | 0.0 /100 | #315 | Tragic $84,451 |
| Immigrants | Haiti | 0.0 /100 | #316 | Tragic $84,018 |
| Yakama | 0.0 /100 | #317 | Tragic $83,932 |
| Immigrants | Mexico | 0.0 /100 | #318 | Tragic $83,639 |
| Immigrants | Honduras | 0.0 /100 | #319 | Tragic $83,618 |
| Seminole | 0.0 /100 | #320 | Tragic $83,354 |
| Immigrants | Caribbean | 0.0 /100 | #321 | Tragic $83,319 |
| Dominicans | 0.0 /100 | #322 | Tragic $82,888 |