American vs Immigrants from Trinidad and Tobago Child Poverty Under the Age of 16
COMPARE
American
Immigrants from Trinidad and Tobago
Child Poverty Under the Age of 16
Child Poverty Under the Age of 16 Comparison
Americans
Immigrants from Trinidad and Tobago
18.3%
CHILD POVERTY UNDER THE AGE OF 16
1.2/ 100
METRIC RATING
232nd/ 347
METRIC RANK
19.1%
CHILD POVERTY UNDER THE AGE OF 16
0.3/ 100
METRIC RATING
252nd/ 347
METRIC RANK
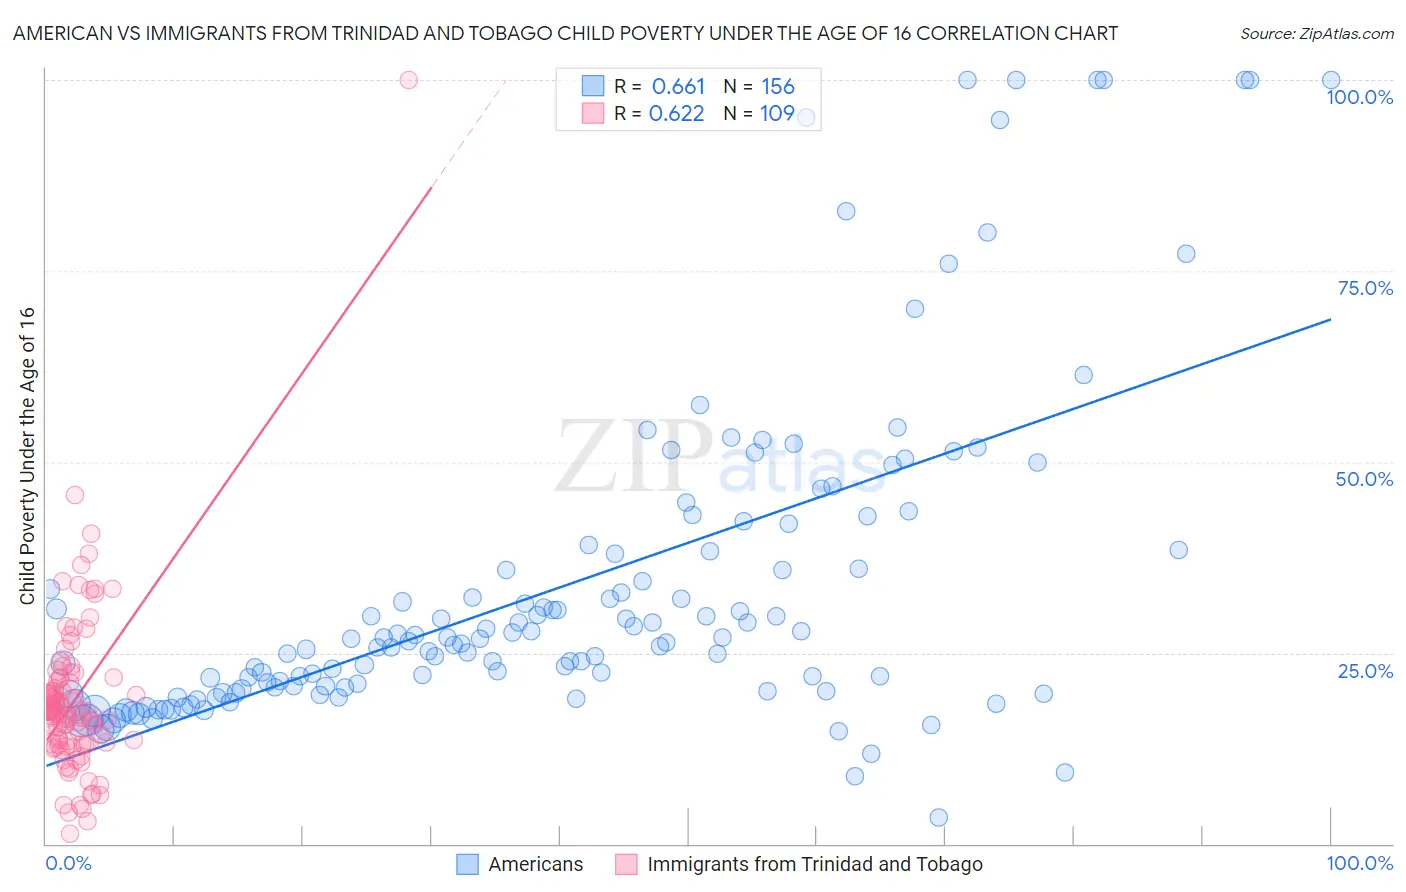
American vs Immigrants from Trinidad and Tobago Child Poverty Under the Age of 16 Correlation Chart
The statistical analysis conducted on geographies consisting of 567,812,680 people shows a significant positive correlation between the proportion of Americans and poverty level among children under the age of 16 in the United States with a correlation coefficient (R) of 0.661 and weighted average of 18.3%. Similarly, the statistical analysis conducted on geographies consisting of 222,555,778 people shows a significant positive correlation between the proportion of Immigrants from Trinidad and Tobago and poverty level among children under the age of 16 in the United States with a correlation coefficient (R) of 0.622 and weighted average of 19.1%, a difference of 4.0%.
Child Poverty Under the Age of 16 Correlation Summary
| Measurement | American | Immigrants from Trinidad and Tobago |
| Minimum | 3.4% | 1.3% |
| Maximum | 100.0% | 100.0% |
| Range | 96.6% | 98.7% |
| Mean | 33.5% | 18.8% |
| Median | 26.4% | 17.4% |
| Interquartile 25% (IQ1) | 20.2% | 13.2% |
| Interquartile 75% (IQ3) | 38.2% | 21.5% |
| Interquartile Range (IQR) | 18.0% | 8.3% |
| Standard Deviation (Sample) | 21.4% | 11.3% |
| Standard Deviation (Population) | 21.3% | 11.2% |
Demographics Similar to Americans and Immigrants from Trinidad and Tobago by Child Poverty Under the Age of 16
In terms of child poverty under the age of 16, the demographic groups most similar to Americans are Fijian (18.4%, a difference of 0.22%), Immigrants from Nigeria (18.4%, a difference of 0.47%), Nigerian (18.4%, a difference of 0.53%), Cree (18.5%, a difference of 0.82%), and Sudanese (18.5%, a difference of 0.85%). Similarly, the demographic groups most similar to Immigrants from Trinidad and Tobago are Immigrants from Ghana (19.1%, a difference of 0.070%), Immigrants from Middle Africa (19.0%, a difference of 0.23%), Potawatomi (19.0%, a difference of 0.43%), Ecuadorian (19.0%, a difference of 0.62%), and French American Indian (18.9%, a difference of 1.1%).
| Demographics | Rating | Rank | Child Poverty Under the Age of 16 |
| Americans | 1.2 /100 | #232 | Tragic 18.3% |
| Fijians | 1.1 /100 | #233 | Tragic 18.4% |
| Immigrants | Nigeria | 1.0 /100 | #234 | Tragic 18.4% |
| Nigerians | 1.0 /100 | #235 | Tragic 18.4% |
| Cree | 0.9 /100 | #236 | Tragic 18.5% |
| Sudanese | 0.9 /100 | #237 | Tragic 18.5% |
| Immigrants | Eritrea | 0.8 /100 | #238 | Tragic 18.5% |
| Immigrants | Sudan | 0.8 /100 | #239 | Tragic 18.5% |
| Ghanaians | 0.8 /100 | #240 | Tragic 18.6% |
| Alsatians | 0.7 /100 | #241 | Tragic 18.6% |
| Immigrants | Laos | 0.6 /100 | #242 | Tragic 18.7% |
| Immigrants | Cuba | 0.6 /100 | #243 | Tragic 18.7% |
| Cape Verdeans | 0.6 /100 | #244 | Tragic 18.7% |
| Shoshone | 0.5 /100 | #245 | Tragic 18.8% |
| Immigrants | Nicaragua | 0.4 /100 | #246 | Tragic 18.8% |
| French American Indians | 0.4 /100 | #247 | Tragic 18.9% |
| Ecuadorians | 0.3 /100 | #248 | Tragic 19.0% |
| Potawatomi | 0.3 /100 | #249 | Tragic 19.0% |
| Immigrants | Middle Africa | 0.3 /100 | #250 | Tragic 19.0% |
| Immigrants | Ghana | 0.3 /100 | #251 | Tragic 19.1% |
| Immigrants | Trinidad and Tobago | 0.3 /100 | #252 | Tragic 19.1% |