American vs Austrian Median Female Earnings
COMPARE
American
Austrian
Median Female Earnings
Median Female Earnings Comparison
Americans
Austrians
$35,777
MEDIAN FEMALE EARNINGS
0.0/ 100
METRIC RATING
292nd/ 347
METRIC RANK
$40,923
MEDIAN FEMALE EARNINGS
92.7/ 100
METRIC RATING
125th/ 347
METRIC RANK
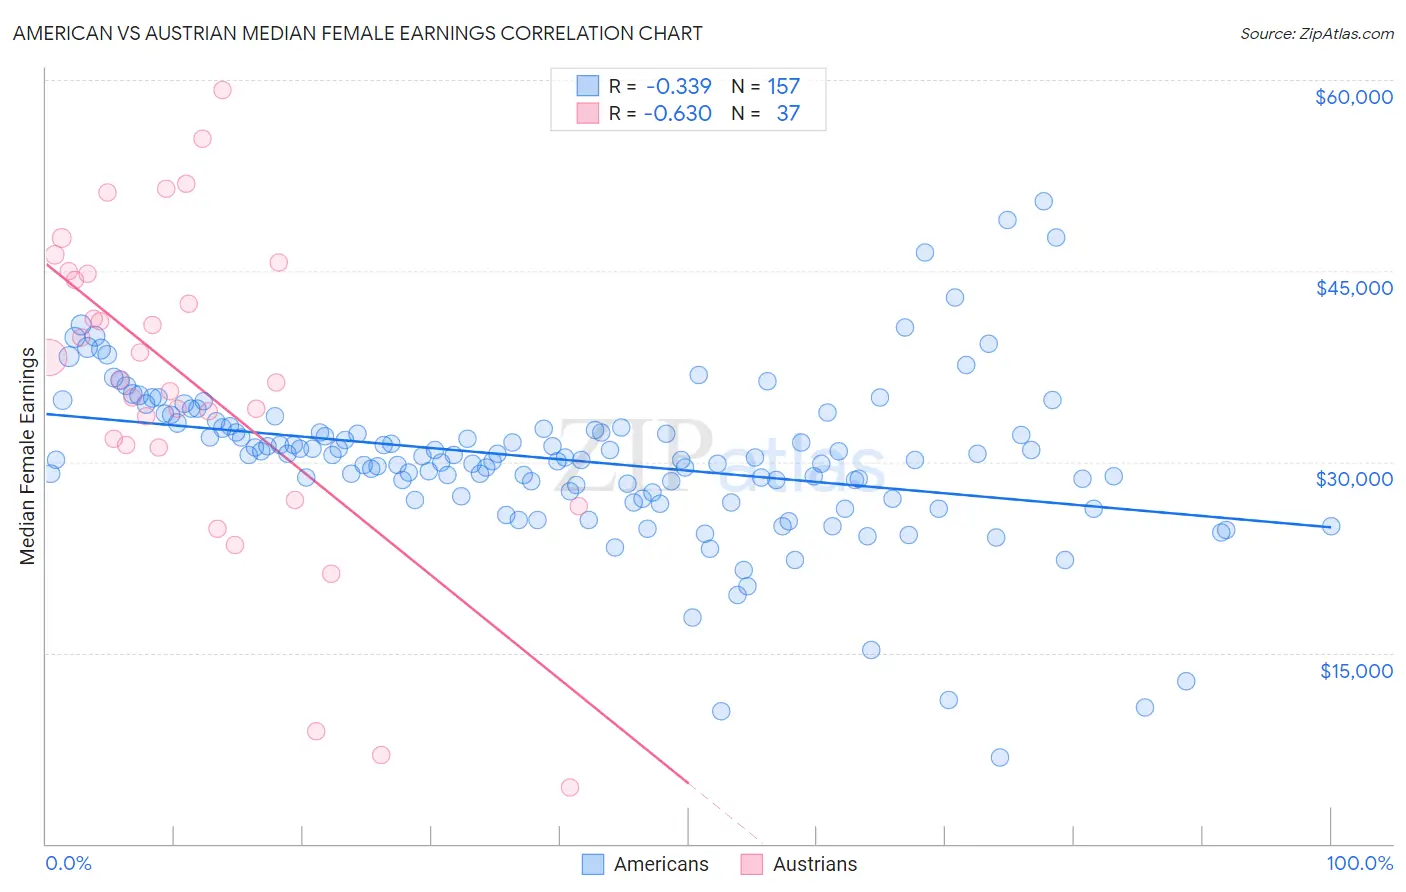
American vs Austrian Median Female Earnings Correlation Chart
The statistical analysis conducted on geographies consisting of 579,438,585 people shows a mild negative correlation between the proportion of Americans and median female earnings in the United States with a correlation coefficient (R) of -0.339 and weighted average of $35,777. Similarly, the statistical analysis conducted on geographies consisting of 451,723,547 people shows a significant negative correlation between the proportion of Austrians and median female earnings in the United States with a correlation coefficient (R) of -0.630 and weighted average of $40,923, a difference of 14.4%.
Median Female Earnings Correlation Summary
| Measurement | American | Austrian |
| Minimum | $6,772 | $4,400 |
| Maximum | $50,517 | $59,167 |
| Range | $43,745 | $54,767 |
| Mean | $30,170 | $36,245 |
| Median | $30,366 | $36,406 |
| Interquartile 25% (IQ1) | $27,419 | $31,217 |
| Interquartile 75% (IQ3) | $32,737 | $44,864 |
| Interquartile Range (IQR) | $5,318 | $13,647 |
| Standard Deviation (Sample) | $6,408 | $12,547 |
| Standard Deviation (Population) | $6,387 | $12,376 |
Similar Demographics by Median Female Earnings
Demographics Similar to Americans by Median Female Earnings
In terms of median female earnings, the demographic groups most similar to Americans are Guatemalan ($35,695, a difference of 0.23%), Blackfeet ($35,864, a difference of 0.24%), Cheyenne ($35,673, a difference of 0.29%), Comanche ($35,661, a difference of 0.32%), and Mexican American Indian ($35,629, a difference of 0.42%).
| Demographics | Rating | Rank | Median Female Earnings |
| Paiute | 0.1 /100 | #285 | Tragic $36,056 |
| Osage | 0.0 /100 | #286 | Tragic $36,034 |
| Immigrants | Nicaragua | 0.0 /100 | #287 | Tragic $36,023 |
| Immigrants | Zaire | 0.0 /100 | #288 | Tragic $36,017 |
| Bangladeshis | 0.0 /100 | #289 | Tragic $35,960 |
| Central American Indians | 0.0 /100 | #290 | Tragic $35,930 |
| Blackfeet | 0.0 /100 | #291 | Tragic $35,864 |
| Americans | 0.0 /100 | #292 | Tragic $35,777 |
| Guatemalans | 0.0 /100 | #293 | Tragic $35,695 |
| Cheyenne | 0.0 /100 | #294 | Tragic $35,673 |
| Comanche | 0.0 /100 | #295 | Tragic $35,661 |
| Mexican American Indians | 0.0 /100 | #296 | Tragic $35,629 |
| Hmong | 0.0 /100 | #297 | Tragic $35,498 |
| Immigrants | Micronesia | 0.0 /100 | #298 | Tragic $35,477 |
| Immigrants | Guatemala | 0.0 /100 | #299 | Tragic $35,444 |
Demographics Similar to Austrians by Median Female Earnings
In terms of median female earnings, the demographic groups most similar to Austrians are Immigrants from Trinidad and Tobago ($40,895, a difference of 0.070%), Ugandan ($40,889, a difference of 0.080%), Trinidadian and Tobagonian ($40,958, a difference of 0.090%), Guyanese ($40,973, a difference of 0.12%), and Immigrants from Jordan ($40,977, a difference of 0.13%).
| Demographics | Rating | Rank | Median Female Earnings |
| Immigrants | Lebanon | 95.6 /100 | #118 | Exceptional $41,183 |
| Immigrants | Philippines | 95.0 /100 | #119 | Exceptional $41,114 |
| Immigrants | Kuwait | 94.4 /100 | #120 | Exceptional $41,055 |
| Croatians | 93.7 /100 | #121 | Exceptional $40,993 |
| Immigrants | Jordan | 93.5 /100 | #122 | Exceptional $40,977 |
| Guyanese | 93.4 /100 | #123 | Exceptional $40,973 |
| Trinidadians and Tobagonians | 93.2 /100 | #124 | Exceptional $40,958 |
| Austrians | 92.7 /100 | #125 | Exceptional $40,923 |
| Immigrants | Trinidad and Tobago | 92.3 /100 | #126 | Exceptional $40,895 |
| Ugandans | 92.2 /100 | #127 | Exceptional $40,889 |
| Carpatho Rusyns | 91.2 /100 | #128 | Exceptional $40,825 |
| Zimbabweans | 90.8 /100 | #129 | Exceptional $40,798 |
| Immigrants | Guyana | 90.3 /100 | #130 | Exceptional $40,773 |
| Chileans | 90.0 /100 | #131 | Exceptional $40,757 |
| Immigrants | Uganda | 89.7 /100 | #132 | Excellent $40,739 |