American vs Immigrants from Malaysia Median Female Earnings
COMPARE
American
Immigrants from Malaysia
Median Female Earnings
Median Female Earnings Comparison
Americans
Immigrants from Malaysia
$35,777
MEDIAN FEMALE EARNINGS
0.0/ 100
METRIC RATING
292nd/ 347
METRIC RANK
$43,835
MEDIAN FEMALE EARNINGS
100.0/ 100
METRIC RATING
40th/ 347
METRIC RANK
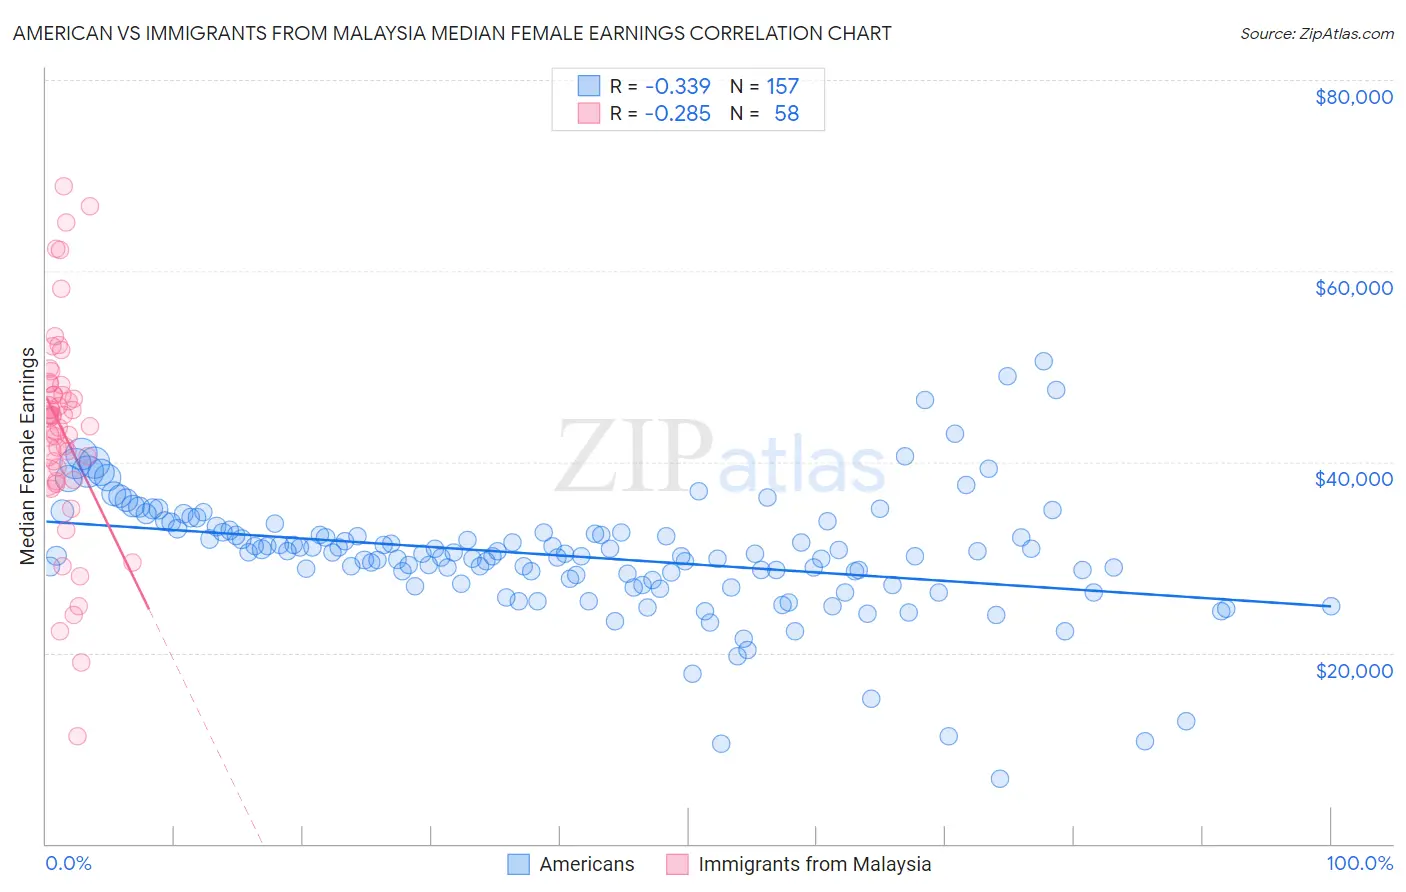
American vs Immigrants from Malaysia Median Female Earnings Correlation Chart
The statistical analysis conducted on geographies consisting of 579,438,585 people shows a mild negative correlation between the proportion of Americans and median female earnings in the United States with a correlation coefficient (R) of -0.339 and weighted average of $35,777. Similarly, the statistical analysis conducted on geographies consisting of 197,943,431 people shows a weak negative correlation between the proportion of Immigrants from Malaysia and median female earnings in the United States with a correlation coefficient (R) of -0.285 and weighted average of $43,835, a difference of 22.5%.
Median Female Earnings Correlation Summary
| Measurement | American | Immigrants from Malaysia |
| Minimum | $6,772 | $11,250 |
| Maximum | $50,517 | $68,919 |
| Range | $43,745 | $57,669 |
| Mean | $30,170 | $43,300 |
| Median | $30,366 | $44,670 |
| Interquartile 25% (IQ1) | $27,419 | $38,363 |
| Interquartile 75% (IQ3) | $32,737 | $48,104 |
| Interquartile Range (IQR) | $5,318 | $9,741 |
| Standard Deviation (Sample) | $6,408 | $11,057 |
| Standard Deviation (Population) | $6,387 | $10,961 |
Similar Demographics by Median Female Earnings
Demographics Similar to Americans by Median Female Earnings
In terms of median female earnings, the demographic groups most similar to Americans are Guatemalan ($35,695, a difference of 0.23%), Blackfeet ($35,864, a difference of 0.24%), Cheyenne ($35,673, a difference of 0.29%), Comanche ($35,661, a difference of 0.32%), and Mexican American Indian ($35,629, a difference of 0.42%).
| Demographics | Rating | Rank | Median Female Earnings |
| Paiute | 0.1 /100 | #285 | Tragic $36,056 |
| Osage | 0.0 /100 | #286 | Tragic $36,034 |
| Immigrants | Nicaragua | 0.0 /100 | #287 | Tragic $36,023 |
| Immigrants | Zaire | 0.0 /100 | #288 | Tragic $36,017 |
| Bangladeshis | 0.0 /100 | #289 | Tragic $35,960 |
| Central American Indians | 0.0 /100 | #290 | Tragic $35,930 |
| Blackfeet | 0.0 /100 | #291 | Tragic $35,864 |
| Americans | 0.0 /100 | #292 | Tragic $35,777 |
| Guatemalans | 0.0 /100 | #293 | Tragic $35,695 |
| Cheyenne | 0.0 /100 | #294 | Tragic $35,673 |
| Comanche | 0.0 /100 | #295 | Tragic $35,661 |
| Mexican American Indians | 0.0 /100 | #296 | Tragic $35,629 |
| Hmong | 0.0 /100 | #297 | Tragic $35,498 |
| Immigrants | Micronesia | 0.0 /100 | #298 | Tragic $35,477 |
| Immigrants | Guatemala | 0.0 /100 | #299 | Tragic $35,444 |
Demographics Similar to Immigrants from Malaysia by Median Female Earnings
In terms of median female earnings, the demographic groups most similar to Immigrants from Malaysia are Israeli ($43,852, a difference of 0.040%), Latvian ($43,941, a difference of 0.24%), Immigrants from Switzerland ($43,996, a difference of 0.37%), Bhutanese ($43,648, a difference of 0.43%), and Immigrants from Denmark ($43,646, a difference of 0.43%).
| Demographics | Rating | Rank | Median Female Earnings |
| Immigrants | Asia | 100.0 /100 | #33 | Exceptional $44,198 |
| Russians | 100.0 /100 | #34 | Exceptional $44,169 |
| Immigrants | Sri Lanka | 100.0 /100 | #35 | Exceptional $44,161 |
| Immigrants | Turkey | 100.0 /100 | #36 | Exceptional $44,066 |
| Immigrants | Switzerland | 100.0 /100 | #37 | Exceptional $43,996 |
| Latvians | 100.0 /100 | #38 | Exceptional $43,941 |
| Israelis | 100.0 /100 | #39 | Exceptional $43,852 |
| Immigrants | Malaysia | 100.0 /100 | #40 | Exceptional $43,835 |
| Bhutanese | 100.0 /100 | #41 | Exceptional $43,648 |
| Immigrants | Denmark | 100.0 /100 | #42 | Exceptional $43,646 |
| Bulgarians | 100.0 /100 | #43 | Exceptional $43,638 |
| Immigrants | Czechoslovakia | 100.0 /100 | #44 | Exceptional $43,571 |
| Immigrants | Europe | 100.0 /100 | #45 | Exceptional $43,523 |
| Immigrants | Bolivia | 100.0 /100 | #46 | Exceptional $43,467 |
| Bolivians | 100.0 /100 | #47 | Exceptional $43,445 |