American vs Immigrants from Romania Vision Disability
COMPARE
American
Immigrants from Romania
Vision Disability
Vision Disability Comparison
Americans
Immigrants from Romania
2.6%
VISION DISABILITY
0.0/ 100
METRIC RATING
312th/ 347
METRIC RANK
2.0%
VISION DISABILITY
99.1/ 100
METRIC RATING
60th/ 347
METRIC RANK
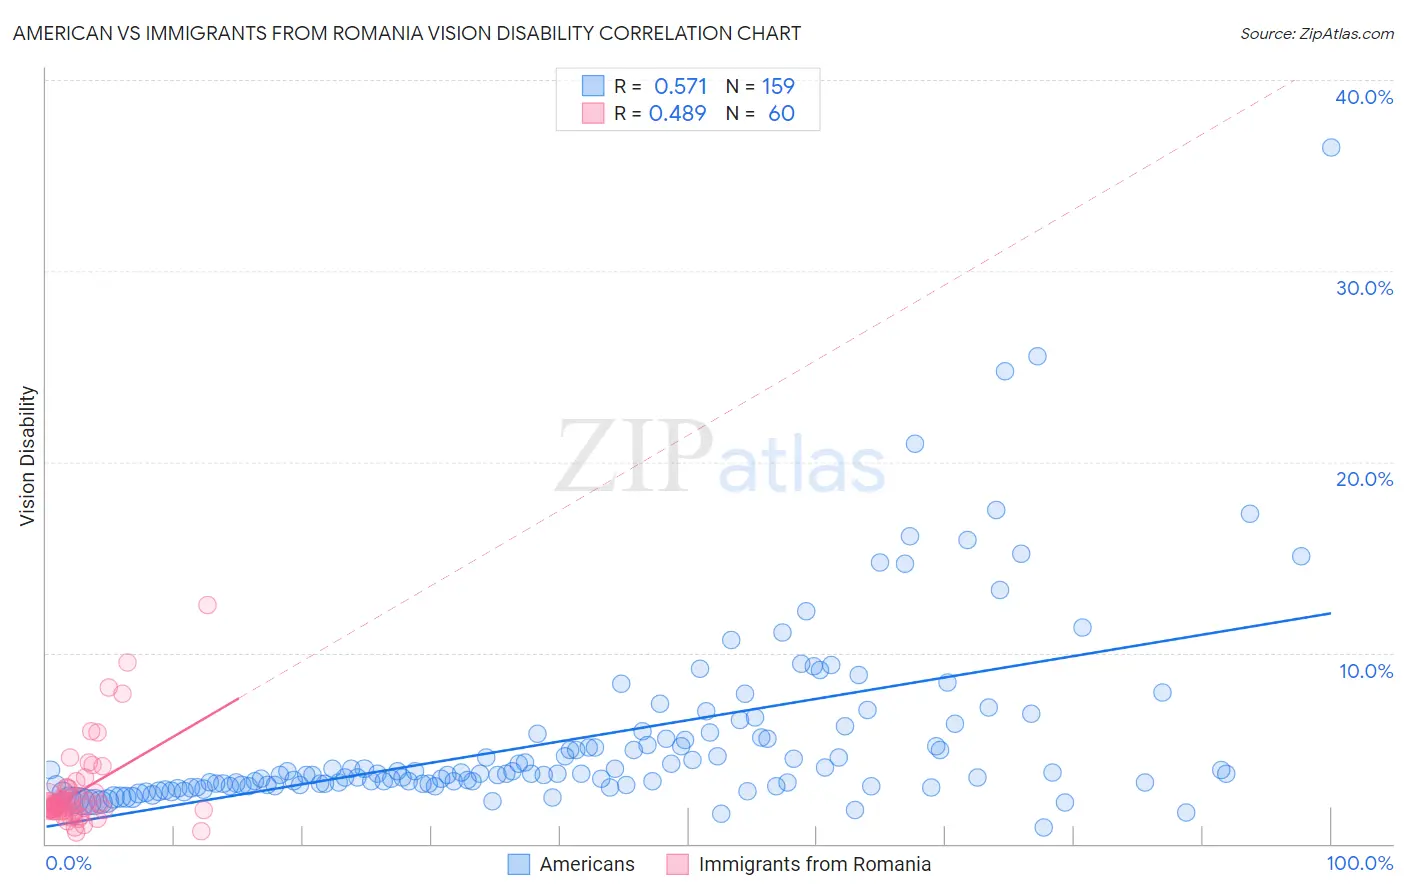
American vs Immigrants from Romania Vision Disability Correlation Chart
The statistical analysis conducted on geographies consisting of 579,371,310 people shows a substantial positive correlation between the proportion of Americans and percentage of population with vision disability in the United States with a correlation coefficient (R) of 0.571 and weighted average of 2.6%. Similarly, the statistical analysis conducted on geographies consisting of 256,950,873 people shows a moderate positive correlation between the proportion of Immigrants from Romania and percentage of population with vision disability in the United States with a correlation coefficient (R) of 0.489 and weighted average of 2.0%, a difference of 32.1%.
Vision Disability Correlation Summary
| Measurement | American | Immigrants from Romania |
| Minimum | 0.84% | 0.58% |
| Maximum | 36.4% | 12.5% |
| Range | 35.6% | 11.9% |
| Mean | 5.5% | 2.7% |
| Median | 3.7% | 2.0% |
| Interquartile 25% (IQ1) | 3.1% | 1.7% |
| Interquartile 75% (IQ3) | 5.6% | 2.8% |
| Interquartile Range (IQR) | 2.5% | 1.0% |
| Standard Deviation (Sample) | 4.9% | 2.2% |
| Standard Deviation (Population) | 4.9% | 2.1% |
Similar Demographics by Vision Disability
Demographics Similar to Americans by Vision Disability
In terms of vision disability, the demographic groups most similar to Americans are Potawatomi (2.6%, a difference of 0.010%), Inupiat (2.7%, a difference of 0.080%), Dominican (2.6%, a difference of 0.83%), Blackfeet (2.6%, a difference of 0.87%), and Immigrants from Yemen (2.6%, a difference of 1.2%).
| Demographics | Rating | Rank | Vision Disability |
| Hispanics or Latinos | 0.0 /100 | #305 | Tragic 2.6% |
| Iroquois | 0.0 /100 | #306 | Tragic 2.6% |
| Immigrants | Dominican Republic | 0.0 /100 | #307 | Tragic 2.6% |
| Arapaho | 0.0 /100 | #308 | Tragic 2.6% |
| Immigrants | Yemen | 0.0 /100 | #309 | Tragic 2.6% |
| Blackfeet | 0.0 /100 | #310 | Tragic 2.6% |
| Dominicans | 0.0 /100 | #311 | Tragic 2.6% |
| Americans | 0.0 /100 | #312 | Tragic 2.6% |
| Potawatomi | 0.0 /100 | #313 | Tragic 2.6% |
| Inupiat | 0.0 /100 | #314 | Tragic 2.7% |
| Osage | 0.0 /100 | #315 | Tragic 2.7% |
| Shoshone | 0.0 /100 | #316 | Tragic 2.7% |
| Yup'ik | 0.0 /100 | #317 | Tragic 2.7% |
| Alaska Natives | 0.0 /100 | #318 | Tragic 2.7% |
| Tohono O'odham | 0.0 /100 | #319 | Tragic 2.8% |
Demographics Similar to Immigrants from Romania by Vision Disability
In terms of vision disability, the demographic groups most similar to Immigrants from Romania are Immigrants from Belgium (2.0%, a difference of 0.010%), Argentinean (2.0%, a difference of 0.030%), Immigrants from Russia (2.0%, a difference of 0.030%), Armenian (2.0%, a difference of 0.15%), and Immigrants from Saudi Arabia (2.0%, a difference of 0.17%).
| Demographics | Rating | Rank | Vision Disability |
| Immigrants | Belarus | 99.3 /100 | #53 | Exceptional 2.0% |
| Macedonians | 99.3 /100 | #54 | Exceptional 2.0% |
| Laotians | 99.3 /100 | #55 | Exceptional 2.0% |
| Jordanians | 99.2 /100 | #56 | Exceptional 2.0% |
| Somalis | 99.2 /100 | #57 | Exceptional 2.0% |
| Immigrants | Saudi Arabia | 99.2 /100 | #58 | Exceptional 2.0% |
| Argentineans | 99.1 /100 | #59 | Exceptional 2.0% |
| Immigrants | Romania | 99.1 /100 | #60 | Exceptional 2.0% |
| Immigrants | Belgium | 99.1 /100 | #61 | Exceptional 2.0% |
| Immigrants | Russia | 99.1 /100 | #62 | Exceptional 2.0% |
| Armenians | 99.0 /100 | #63 | Exceptional 2.0% |
| Immigrants | Greece | 99.0 /100 | #64 | Exceptional 2.0% |
| Maltese | 98.9 /100 | #65 | Exceptional 2.0% |
| Immigrants | Argentina | 98.9 /100 | #66 | Exceptional 2.0% |
| Immigrants | Northern Africa | 98.8 /100 | #67 | Exceptional 2.0% |