American vs Immigrants from Barbados Family Households with Children
COMPARE
American
Immigrants from Barbados
Family Households with Children
Family Households with Children Comparison
Americans
Immigrants from Barbados
27.3%
FAMILY HOUSEHOLDS WITH CHILDREN
22.8/ 100
METRIC RATING
202nd/ 347
METRIC RANK
26.0%
FAMILY HOUSEHOLDS WITH CHILDREN
0.0/ 100
METRIC RATING
327th/ 347
METRIC RANK
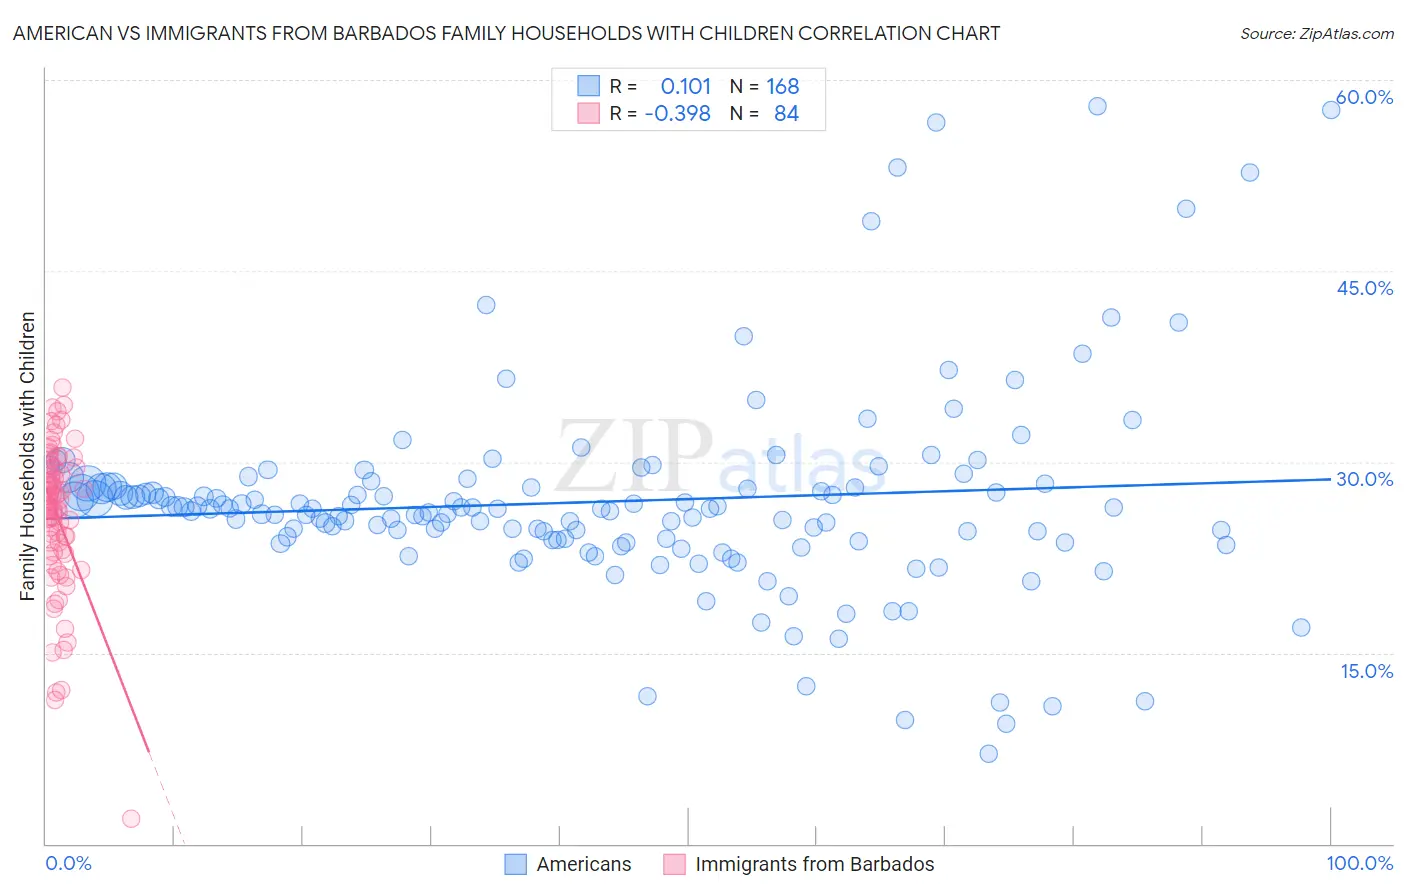
American vs Immigrants from Barbados Family Households with Children Correlation Chart
The statistical analysis conducted on geographies consisting of 580,876,887 people shows a poor positive correlation between the proportion of Americans and percentage of family households with children in the United States with a correlation coefficient (R) of 0.101 and weighted average of 27.3%. Similarly, the statistical analysis conducted on geographies consisting of 112,760,872 people shows a mild negative correlation between the proportion of Immigrants from Barbados and percentage of family households with children in the United States with a correlation coefficient (R) of -0.398 and weighted average of 26.0%, a difference of 5.0%.
Family Households with Children Correlation Summary
| Measurement | American | Immigrants from Barbados |
| Minimum | 7.1% | 2.0% |
| Maximum | 57.9% | 35.9% |
| Range | 50.8% | 33.9% |
| Mean | 26.9% | 25.7% |
| Median | 26.3% | 26.8% |
| Interquartile 25% (IQ1) | 23.8% | 23.0% |
| Interquartile 75% (IQ3) | 28.0% | 29.5% |
| Interquartile Range (IQR) | 4.2% | 6.5% |
| Standard Deviation (Sample) | 7.9% | 5.9% |
| Standard Deviation (Population) | 7.9% | 5.8% |
Similar Demographics by Family Households with Children
Demographics Similar to Americans by Family Households with Children
In terms of family households with children, the demographic groups most similar to Americans are Kiowa (27.3%, a difference of 0.020%), Immigrants from Sudan (27.3%, a difference of 0.040%), Bhutanese (27.3%, a difference of 0.070%), Immigrants from Haiti (27.2%, a difference of 0.080%), and Immigrants from Micronesia (27.2%, a difference of 0.090%).
| Demographics | Rating | Rank | Family Households with Children |
| Crow | 35.7 /100 | #195 | Fair 27.4% |
| Cheyenne | 35.1 /100 | #196 | Fair 27.4% |
| Norwegians | 35.0 /100 | #197 | Fair 27.4% |
| Immigrants | Romania | 34.4 /100 | #198 | Fair 27.4% |
| English | 32.0 /100 | #199 | Fair 27.3% |
| Immigrants | Congo | 28.7 /100 | #200 | Fair 27.3% |
| Bhutanese | 25.1 /100 | #201 | Fair 27.3% |
| Americans | 22.8 /100 | #202 | Fair 27.3% |
| Kiowa | 22.2 /100 | #203 | Fair 27.3% |
| Immigrants | Sudan | 21.6 /100 | #204 | Fair 27.3% |
| Immigrants | Haiti | 20.3 /100 | #205 | Fair 27.2% |
| Immigrants | Micronesia | 20.2 /100 | #206 | Fair 27.2% |
| Haitians | 19.8 /100 | #207 | Poor 27.2% |
| Immigrants | Poland | 16.4 /100 | #208 | Poor 27.2% |
| Dutch West Indians | 15.8 /100 | #209 | Poor 27.2% |
Demographics Similar to Immigrants from Barbados by Family Households with Children
In terms of family households with children, the demographic groups most similar to Immigrants from Barbados are Immigrants from Albania (25.9%, a difference of 0.10%), Immigrants from Ireland (26.0%, a difference of 0.11%), Barbadian (26.0%, a difference of 0.14%), Chinese (26.0%, a difference of 0.19%), and Immigrants from Australia (26.0%, a difference of 0.23%).
| Demographics | Rating | Rank | Family Households with Children |
| Tlingit-Haida | 0.0 /100 | #320 | Tragic 26.0% |
| British West Indians | 0.0 /100 | #321 | Tragic 26.0% |
| Immigrants | Greece | 0.0 /100 | #322 | Tragic 26.0% |
| Immigrants | Australia | 0.0 /100 | #323 | Tragic 26.0% |
| Chinese | 0.0 /100 | #324 | Tragic 26.0% |
| Barbadians | 0.0 /100 | #325 | Tragic 26.0% |
| Immigrants | Ireland | 0.0 /100 | #326 | Tragic 26.0% |
| Immigrants | Barbados | 0.0 /100 | #327 | Tragic 26.0% |
| Immigrants | Albania | 0.0 /100 | #328 | Tragic 25.9% |
| Cypriots | 0.0 /100 | #329 | Tragic 25.9% |
| Immigrants | Latvia | 0.0 /100 | #330 | Tragic 25.9% |
| Slovenes | 0.0 /100 | #331 | Tragic 25.8% |
| Immigrants | Austria | 0.0 /100 | #332 | Tragic 25.8% |
| Immigrants | Switzerland | 0.0 /100 | #333 | Tragic 25.7% |
| Slovaks | 0.0 /100 | #334 | Tragic 25.7% |