Immigrants from Grenada vs Cape Verdean Per Capita Income
COMPARE
Immigrants from Grenada
Cape Verdean
Per Capita Income
Per Capita Income Comparison
Immigrants from Grenada
Cape Verdeans
$41,123
PER CAPITA INCOME
5.5/ 100
METRIC RATING
228th/ 347
METRIC RANK
$39,935
PER CAPITA INCOME
1.5/ 100
METRIC RATING
248th/ 347
METRIC RANK
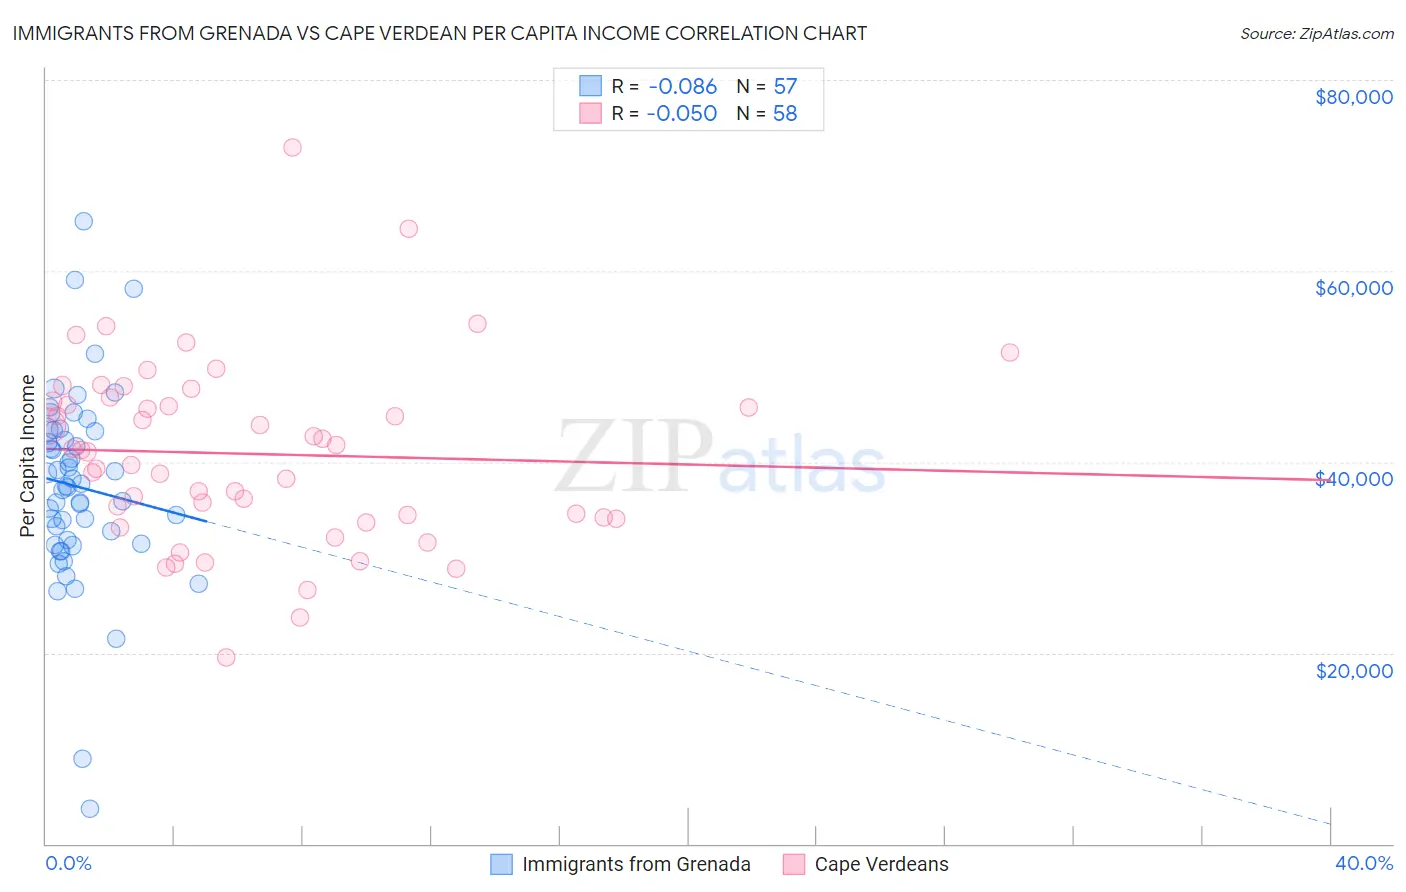
Immigrants from Grenada vs Cape Verdean Per Capita Income Correlation Chart
The statistical analysis conducted on geographies consisting of 67,200,351 people shows a slight negative correlation between the proportion of Immigrants from Grenada and per capita income in the United States with a correlation coefficient (R) of -0.086 and weighted average of $41,123. Similarly, the statistical analysis conducted on geographies consisting of 107,581,213 people shows no correlation between the proportion of Cape Verdeans and per capita income in the United States with a correlation coefficient (R) of -0.050 and weighted average of $39,935, a difference of 3.0%.
Per Capita Income Correlation Summary
| Measurement | Immigrants from Grenada | Cape Verdean |
| Minimum | $3,645 | $19,552 |
| Maximum | $65,209 | $72,967 |
| Range | $61,564 | $53,415 |
| Mean | $37,400 | $40,842 |
| Median | $37,479 | $41,136 |
| Interquartile 25% (IQ1) | $31,664 | $34,180 |
| Interquartile 75% (IQ3) | $43,240 | $46,319 |
| Interquartile Range (IQR) | $11,576 | $12,139 |
| Standard Deviation (Sample) | $10,138 | $9,616 |
| Standard Deviation (Population) | $10,049 | $9,533 |
Demographics Similar to Immigrants from Grenada and Cape Verdeans by Per Capita Income
In terms of per capita income, the demographic groups most similar to Immigrants from Grenada are Nigerian ($41,026, a difference of 0.24%), Native Hawaiian ($41,017, a difference of 0.26%), Senegalese ($41,000, a difference of 0.30%), Guyanese ($40,949, a difference of 0.42%), and Delaware ($40,778, a difference of 0.85%). Similarly, the demographic groups most similar to Cape Verdeans are Immigrants from Somalia ($39,974, a difference of 0.10%), Cree ($40,056, a difference of 0.30%), Subsaharan African ($40,152, a difference of 0.54%), French American Indian ($40,244, a difference of 0.77%), and German Russian ($40,266, a difference of 0.83%).
| Demographics | Rating | Rank | Per Capita Income |
| Immigrants | Grenada | 5.5 /100 | #228 | Tragic $41,123 |
| Nigerians | 4.9 /100 | #229 | Tragic $41,026 |
| Native Hawaiians | 4.9 /100 | #230 | Tragic $41,017 |
| Senegalese | 4.8 /100 | #231 | Tragic $41,000 |
| Guyanese | 4.5 /100 | #232 | Tragic $40,949 |
| Delaware | 3.8 /100 | #233 | Tragic $40,778 |
| Immigrants | West Indies | 3.7 /100 | #234 | Tragic $40,763 |
| Immigrants | Guyana | 3.6 /100 | #235 | Tragic $40,742 |
| Immigrants | Nonimmigrants | 3.4 /100 | #236 | Tragic $40,669 |
| Immigrants | Cambodia | 2.6 /100 | #237 | Tragic $40,434 |
| Somalis | 2.4 /100 | #238 | Tragic $40,367 |
| Tsimshian | 2.4 /100 | #239 | Tragic $40,344 |
| Immigrants | Nigeria | 2.3 /100 | #240 | Tragic $40,339 |
| British West Indians | 2.3 /100 | #241 | Tragic $40,330 |
| Immigrants | Western Africa | 2.2 /100 | #242 | Tragic $40,294 |
| German Russians | 2.2 /100 | #243 | Tragic $40,266 |
| French American Indians | 2.1 /100 | #244 | Tragic $40,244 |
| Sub-Saharan Africans | 1.9 /100 | #245 | Tragic $40,152 |
| Cree | 1.7 /100 | #246 | Tragic $40,056 |
| Immigrants | Somalia | 1.6 /100 | #247 | Tragic $39,974 |
| Cape Verdeans | 1.5 /100 | #248 | Tragic $39,935 |