Portuguese vs Aleut Median Family Income
COMPARE
Portuguese
Aleut
Median Family Income
Median Family Income Comparison
Portuguese
Aleuts
$106,286
MEDIAN FAMILY INCOME
86.3/ 100
METRIC RATING
135th/ 347
METRIC RANK
$98,702
MEDIAN FAMILY INCOME
11.6/ 100
METRIC RATING
207th/ 347
METRIC RANK
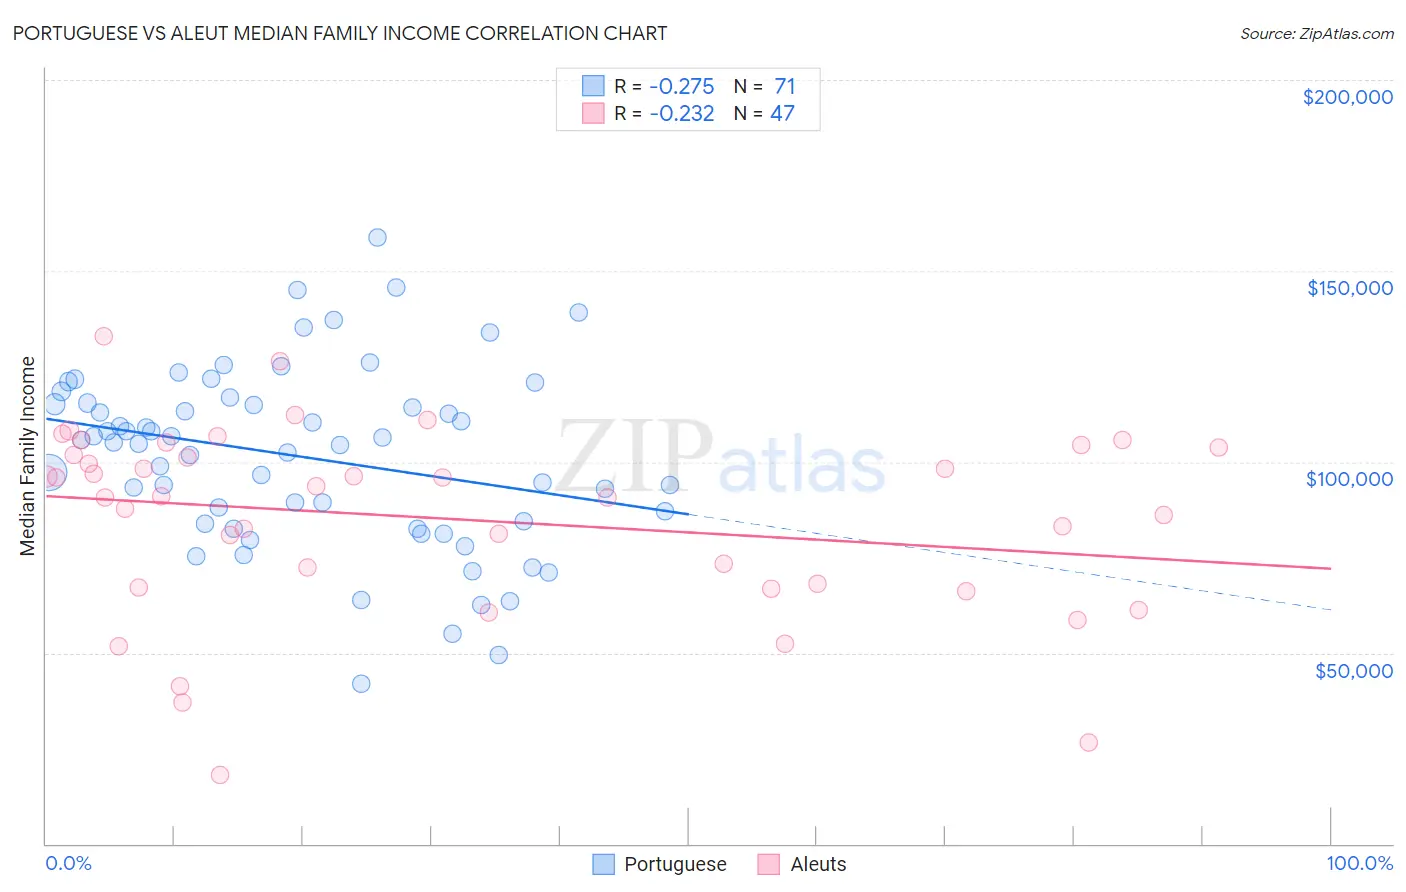
Portuguese vs Aleut Median Family Income Correlation Chart
The statistical analysis conducted on geographies consisting of 449,790,054 people shows a weak negative correlation between the proportion of Portuguese and median family income in the United States with a correlation coefficient (R) of -0.275 and weighted average of $106,286. Similarly, the statistical analysis conducted on geographies consisting of 61,771,380 people shows a weak negative correlation between the proportion of Aleuts and median family income in the United States with a correlation coefficient (R) of -0.232 and weighted average of $98,702, a difference of 7.7%.
Median Family Income Correlation Summary
| Measurement | Portuguese | Aleut |
| Minimum | $41,875 | $18,125 |
| Maximum | $158,667 | $132,750 |
| Range | $116,792 | $114,625 |
| Mean | $101,290 | $85,071 |
| Median | $105,008 | $90,875 |
| Interquartile 25% (IQ1) | $83,759 | $67,198 |
| Interquartile 75% (IQ3) | $115,390 | $103,750 |
| Interquartile Range (IQR) | $31,631 | $36,552 |
| Standard Deviation (Sample) | $23,601 | $24,932 |
| Standard Deviation (Population) | $23,434 | $24,665 |
Similar Demographics by Median Family Income
Demographics Similar to Portuguese by Median Family Income
In terms of median family income, the demographic groups most similar to Portuguese are Immigrants from South Eastern Asia ($106,252, a difference of 0.030%), Immigrants from Uganda ($106,188, a difference of 0.090%), Immigrants from Vietnam ($106,186, a difference of 0.090%), Luxembourger ($106,183, a difference of 0.10%), and Norwegian ($106,144, a difference of 0.13%).
| Demographics | Rating | Rank | Median Family Income |
| Immigrants | Ethiopia | 90.0 /100 | #128 | Excellent $106,969 |
| Arabs | 89.9 /100 | #129 | Excellent $106,952 |
| Brazilians | 89.8 /100 | #130 | Excellent $106,942 |
| Canadians | 88.1 /100 | #131 | Excellent $106,597 |
| Immigrants | Fiji | 87.8 /100 | #132 | Excellent $106,544 |
| Ugandans | 87.8 /100 | #133 | Excellent $106,541 |
| Immigrants | Oceania | 87.3 /100 | #134 | Excellent $106,453 |
| Portuguese | 86.3 /100 | #135 | Excellent $106,286 |
| Immigrants | South Eastern Asia | 86.1 /100 | #136 | Excellent $106,252 |
| Immigrants | Uganda | 85.7 /100 | #137 | Excellent $106,188 |
| Immigrants | Vietnam | 85.7 /100 | #138 | Excellent $106,186 |
| Luxembourgers | 85.7 /100 | #139 | Excellent $106,183 |
| Norwegians | 85.5 /100 | #140 | Excellent $106,144 |
| Immigrants | Syria | 85.3 /100 | #141 | Excellent $106,118 |
| Slovenes | 84.7 /100 | #142 | Excellent $106,020 |
Demographics Similar to Aleuts by Median Family Income
In terms of median family income, the demographic groups most similar to Aleuts are Immigrants from Iraq ($98,786, a difference of 0.080%), Hawaiian ($98,869, a difference of 0.17%), Ghanaian ($98,877, a difference of 0.18%), Immigrants from Uruguay ($98,205, a difference of 0.51%), and Immigrants from Colombia ($98,067, a difference of 0.65%).
| Demographics | Rating | Rank | Median Family Income |
| Spanish | 20.1 /100 | #200 | Fair $99,977 |
| Immigrants | Thailand | 19.0 /100 | #201 | Poor $99,840 |
| Whites/Caucasians | 18.7 /100 | #202 | Poor $99,800 |
| Scotch-Irish | 17.1 /100 | #203 | Poor $99,591 |
| Ghanaians | 12.6 /100 | #204 | Poor $98,877 |
| Hawaiians | 12.5 /100 | #205 | Poor $98,869 |
| Immigrants | Iraq | 12.1 /100 | #206 | Poor $98,786 |
| Aleuts | 11.6 /100 | #207 | Poor $98,702 |
| Immigrants | Uruguay | 9.2 /100 | #208 | Tragic $98,205 |
| Immigrants | Colombia | 8.7 /100 | #209 | Tragic $98,067 |
| Puget Sound Salish | 8.2 /100 | #210 | Tragic $97,958 |
| Immigrants | Sudan | 7.4 /100 | #211 | Tragic $97,737 |
| Panamanians | 7.2 /100 | #212 | Tragic $97,683 |
| Immigrants | Armenia | 7.0 /100 | #213 | Tragic $97,605 |
| Bermudans | 6.9 /100 | #214 | Tragic $97,577 |