Immigrants from Uruguay vs Aleut Median Family Income
COMPARE
Immigrants from Uruguay
Aleut
Median Family Income
Median Family Income Comparison
Immigrants from Uruguay
Aleuts
$98,205
MEDIAN FAMILY INCOME
9.2/ 100
METRIC RATING
208th/ 347
METRIC RANK
$98,702
MEDIAN FAMILY INCOME
11.6/ 100
METRIC RATING
207th/ 347
METRIC RANK
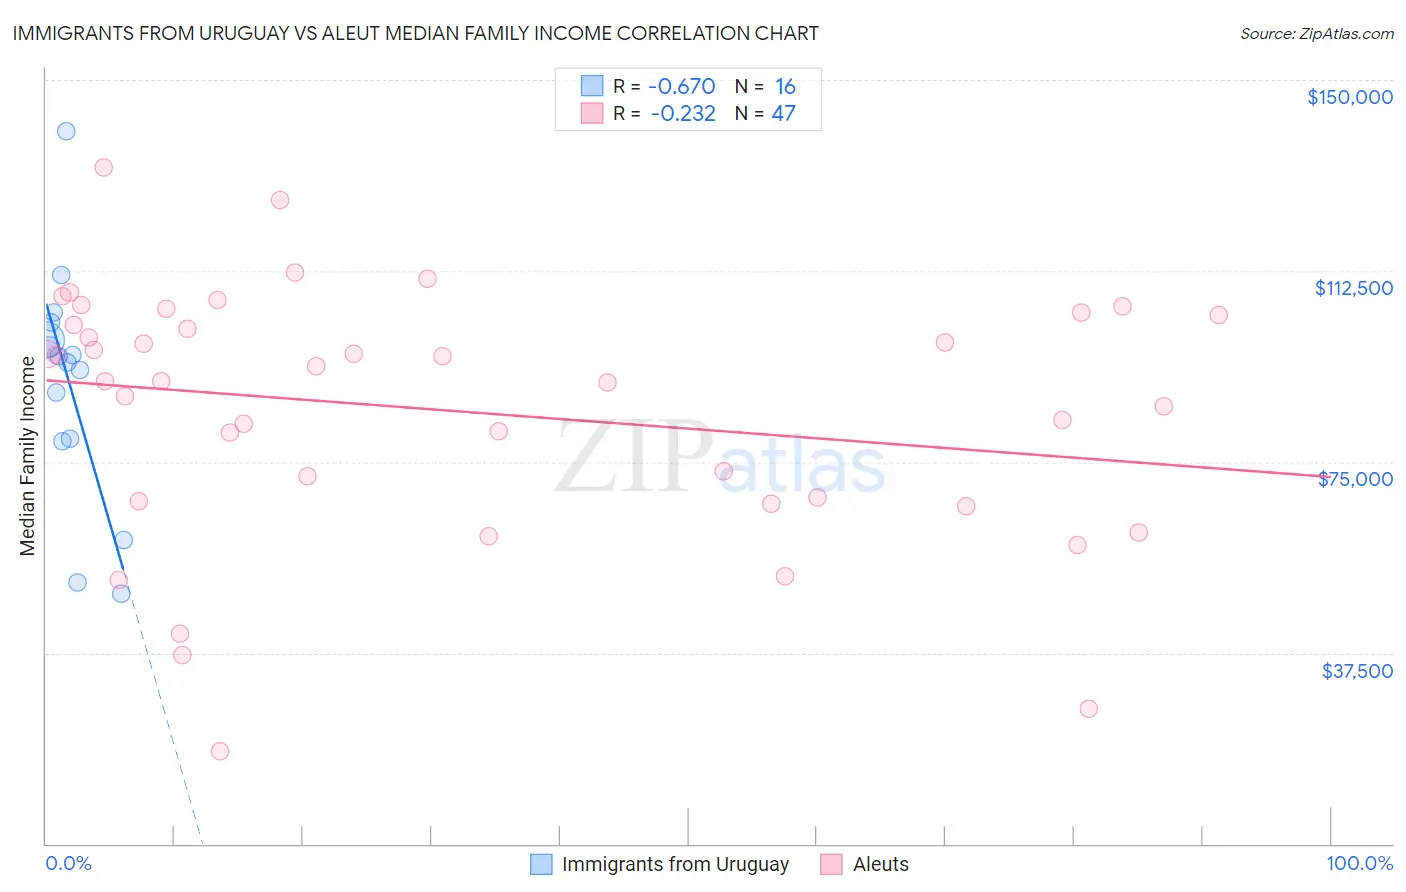
Immigrants from Uruguay vs Aleut Median Family Income Correlation Chart
The statistical analysis conducted on geographies consisting of 133,244,863 people shows a significant negative correlation between the proportion of Immigrants from Uruguay and median family income in the United States with a correlation coefficient (R) of -0.670 and weighted average of $98,205. Similarly, the statistical analysis conducted on geographies consisting of 61,771,380 people shows a weak negative correlation between the proportion of Aleuts and median family income in the United States with a correlation coefficient (R) of -0.232 and weighted average of $98,702, a difference of 0.51%.
Median Family Income Correlation Summary
| Measurement | Immigrants from Uruguay | Aleut |
| Minimum | $49,007 | $18,125 |
| Maximum | $139,969 | $132,750 |
| Range | $90,962 | $114,625 |
| Mean | $90,062 | $85,071 |
| Median | $95,116 | $90,875 |
| Interquartile 25% (IQ1) | $79,263 | $67,198 |
| Interquartile 75% (IQ3) | $100,653 | $103,750 |
| Interquartile Range (IQR) | $21,390 | $36,552 |
| Standard Deviation (Sample) | $22,948 | $24,932 |
| Standard Deviation (Population) | $22,219 | $24,665 |
Demographics Similar to Immigrants from Uruguay and Aleuts by Median Family Income
In terms of median family income, the demographic groups most similar to Immigrants from Uruguay are Immigrants from Colombia ($98,067, a difference of 0.14%), Puget Sound Salish ($97,958, a difference of 0.25%), Immigrants from Sudan ($97,737, a difference of 0.48%), Panamanian ($97,683, a difference of 0.53%), and Immigrants from Iraq ($98,786, a difference of 0.59%). Similarly, the demographic groups most similar to Aleuts are Immigrants from Iraq ($98,786, a difference of 0.080%), Hawaiian ($98,869, a difference of 0.17%), Ghanaian ($98,877, a difference of 0.18%), Immigrants from Colombia ($98,067, a difference of 0.65%), and Puget Sound Salish ($97,958, a difference of 0.76%).
| Demographics | Rating | Rank | Median Family Income |
| Immigrants | Cameroon | 22.8 /100 | #197 | Fair $100,289 |
| Immigrants | Africa | 22.5 /100 | #198 | Fair $100,256 |
| Yugoslavians | 21.3 /100 | #199 | Fair $100,119 |
| Spanish | 20.1 /100 | #200 | Fair $99,977 |
| Immigrants | Thailand | 19.0 /100 | #201 | Poor $99,840 |
| Whites/Caucasians | 18.7 /100 | #202 | Poor $99,800 |
| Scotch-Irish | 17.1 /100 | #203 | Poor $99,591 |
| Ghanaians | 12.6 /100 | #204 | Poor $98,877 |
| Hawaiians | 12.5 /100 | #205 | Poor $98,869 |
| Immigrants | Iraq | 12.1 /100 | #206 | Poor $98,786 |
| Aleuts | 11.6 /100 | #207 | Poor $98,702 |
| Immigrants | Uruguay | 9.2 /100 | #208 | Tragic $98,205 |
| Immigrants | Colombia | 8.7 /100 | #209 | Tragic $98,067 |
| Puget Sound Salish | 8.2 /100 | #210 | Tragic $97,958 |
| Immigrants | Sudan | 7.4 /100 | #211 | Tragic $97,737 |
| Panamanians | 7.2 /100 | #212 | Tragic $97,683 |
| Immigrants | Armenia | 7.0 /100 | #213 | Tragic $97,605 |
| Bermudans | 6.9 /100 | #214 | Tragic $97,577 |
| Nigerians | 6.7 /100 | #215 | Tragic $97,522 |
| Immigrants | Bosnia and Herzegovina | 6.4 /100 | #216 | Tragic $97,432 |
| Japanese | 6.0 /100 | #217 | Tragic $97,288 |