Alsatian vs Sioux Single Mother Households
COMPARE
Alsatian
Sioux
Single Mother Households
Single Mother Households Comparison
Alsatians
Sioux
6.2%
SINGLE MOTHER HOUSEHOLDS
68.7/ 100
METRIC RATING
163rd/ 347
METRIC RANK
8.5%
SINGLE MOTHER HOUSEHOLDS
0.0/ 100
METRIC RATING
331st/ 347
METRIC RANK
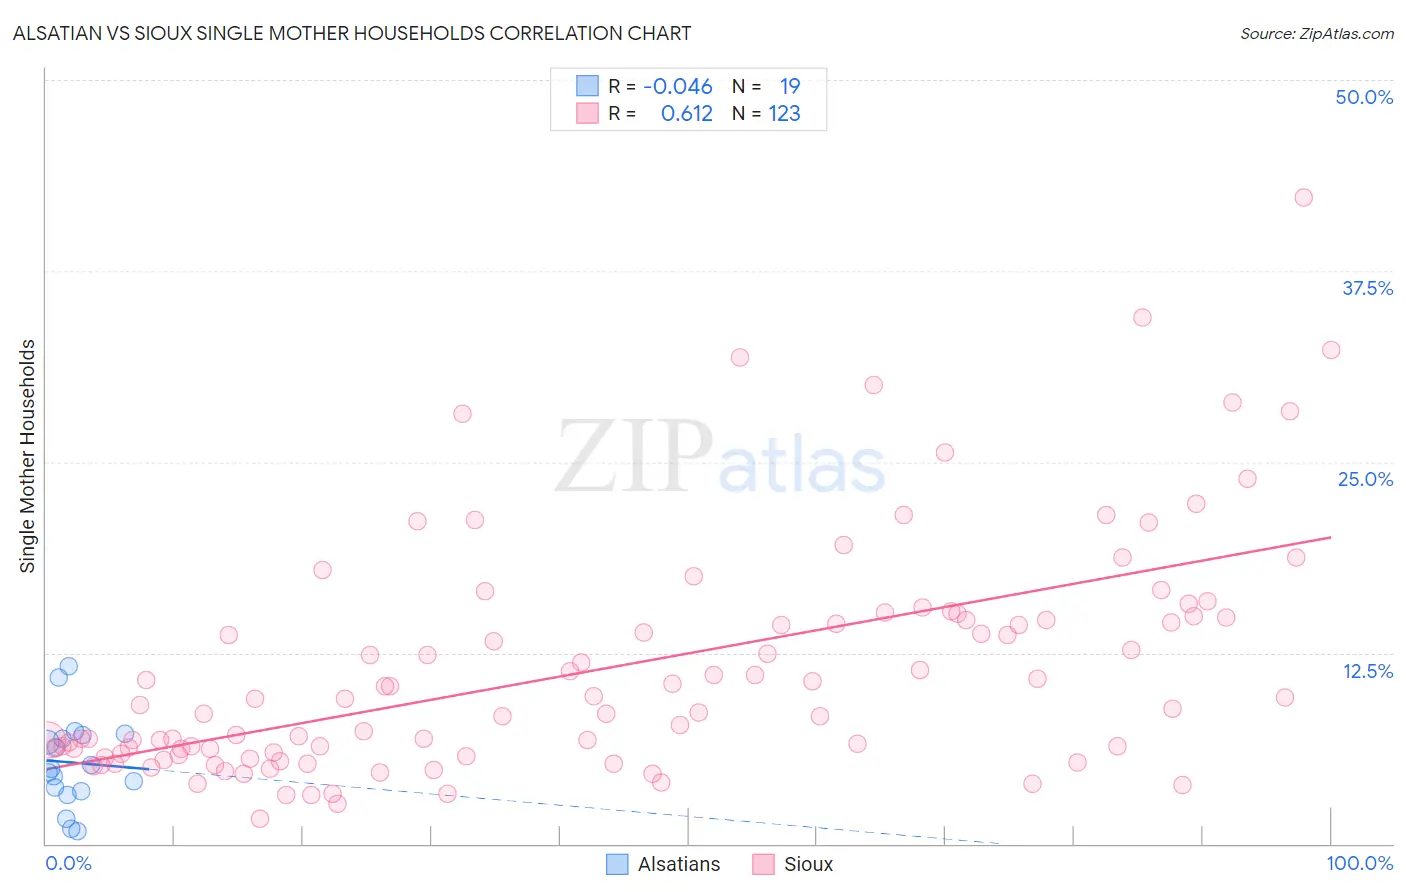
Alsatian vs Sioux Single Mother Households Correlation Chart
The statistical analysis conducted on geographies consisting of 82,530,360 people shows no correlation between the proportion of Alsatians and percentage of single mother households in the United States with a correlation coefficient (R) of -0.046 and weighted average of 6.2%. Similarly, the statistical analysis conducted on geographies consisting of 233,811,007 people shows a significant positive correlation between the proportion of Sioux and percentage of single mother households in the United States with a correlation coefficient (R) of 0.612 and weighted average of 8.5%, a difference of 37.4%.
Single Mother Households Correlation Summary
| Measurement | Alsatian | Sioux |
| Minimum | 0.84% | 1.6% |
| Maximum | 11.6% | 42.3% |
| Range | 10.8% | 40.7% |
| Mean | 5.3% | 11.4% |
| Median | 4.9% | 9.1% |
| Interquartile 25% (IQ1) | 3.4% | 5.9% |
| Interquartile 75% (IQ3) | 7.1% | 14.8% |
| Interquartile Range (IQR) | 3.7% | 8.9% |
| Standard Deviation (Sample) | 2.9% | 7.6% |
| Standard Deviation (Population) | 2.8% | 7.6% |
Similar Demographics by Single Mother Households
Demographics Similar to Alsatians by Single Mother Households
In terms of single mother households, the demographic groups most similar to Alsatians are Immigrants from Northern Africa (6.2%, a difference of 0.090%), Immigrants from Zimbabwe (6.2%, a difference of 0.16%), Immigrants from Syria (6.2%, a difference of 0.16%), Immigrants from Germany (6.1%, a difference of 0.51%), and Iraqi (6.1%, a difference of 0.59%).
| Demographics | Rating | Rank | Single Mother Households |
| Native Hawaiians | 75.0 /100 | #156 | Good 6.1% |
| Chileans | 74.2 /100 | #157 | Good 6.1% |
| Celtics | 73.3 /100 | #158 | Good 6.1% |
| Yugoslavians | 73.1 /100 | #159 | Good 6.1% |
| Iraqis | 73.0 /100 | #160 | Good 6.1% |
| Immigrants | Germany | 72.4 /100 | #161 | Good 6.1% |
| Immigrants | Zimbabwe | 69.9 /100 | #162 | Good 6.2% |
| Alsatians | 68.7 /100 | #163 | Good 6.2% |
| Immigrants | Northern Africa | 68.0 /100 | #164 | Good 6.2% |
| Immigrants | Syria | 67.4 /100 | #165 | Good 6.2% |
| Sri Lankans | 63.9 /100 | #166 | Good 6.2% |
| Brazilians | 59.1 /100 | #167 | Average 6.2% |
| Immigrants | Chile | 58.3 /100 | #168 | Average 6.3% |
| Puget Sound Salish | 58.1 /100 | #169 | Average 6.3% |
| Immigrants | Oceania | 54.6 /100 | #170 | Average 6.3% |
Demographics Similar to Sioux by Single Mother Households
In terms of single mother households, the demographic groups most similar to Sioux are Inupiat (8.5%, a difference of 0.0%), Hopi (8.5%, a difference of 0.11%), Yakama (8.4%, a difference of 0.86%), Immigrants from Haiti (8.4%, a difference of 1.0%), and British West Indian (8.4%, a difference of 1.2%).
| Demographics | Rating | Rank | Single Mother Households |
| Immigrants | Jamaica | 0.0 /100 | #324 | Tragic 8.4% |
| Immigrants | Caribbean | 0.0 /100 | #325 | Tragic 8.4% |
| British West Indians | 0.0 /100 | #326 | Tragic 8.4% |
| Immigrants | Haiti | 0.0 /100 | #327 | Tragic 8.4% |
| Yakama | 0.0 /100 | #328 | Tragic 8.4% |
| Hopi | 0.0 /100 | #329 | Tragic 8.5% |
| Inupiat | 0.0 /100 | #330 | Tragic 8.5% |
| Sioux | 0.0 /100 | #331 | Tragic 8.5% |
| U.S. Virgin Islanders | 0.0 /100 | #332 | Tragic 8.6% |
| Liberians | 0.0 /100 | #333 | Tragic 8.6% |
| Immigrants | Liberia | 0.0 /100 | #334 | Tragic 8.7% |
| Immigrants | Dominica | 0.0 /100 | #335 | Tragic 8.7% |
| Puerto Ricans | 0.0 /100 | #336 | Tragic 8.7% |
| Navajo | 0.0 /100 | #337 | Tragic 8.8% |
| Cape Verdeans | 0.0 /100 | #338 | Tragic 8.9% |