Immigrants from Grenada vs Navajo Householder Income Under 25 years
COMPARE
Immigrants from Grenada
Navajo
Householder Income Under 25 years
Householder Income Under 25 years Comparison
Immigrants from Grenada
Navajo
$54,538
HOUSEHOLDER INCOME UNDER 25 YEARS
99.7/ 100
METRIC RATING
74th/ 347
METRIC RANK
$42,380
HOUSEHOLDER INCOME UNDER 25 YEARS
0.0/ 100
METRIC RATING
345th/ 347
METRIC RANK
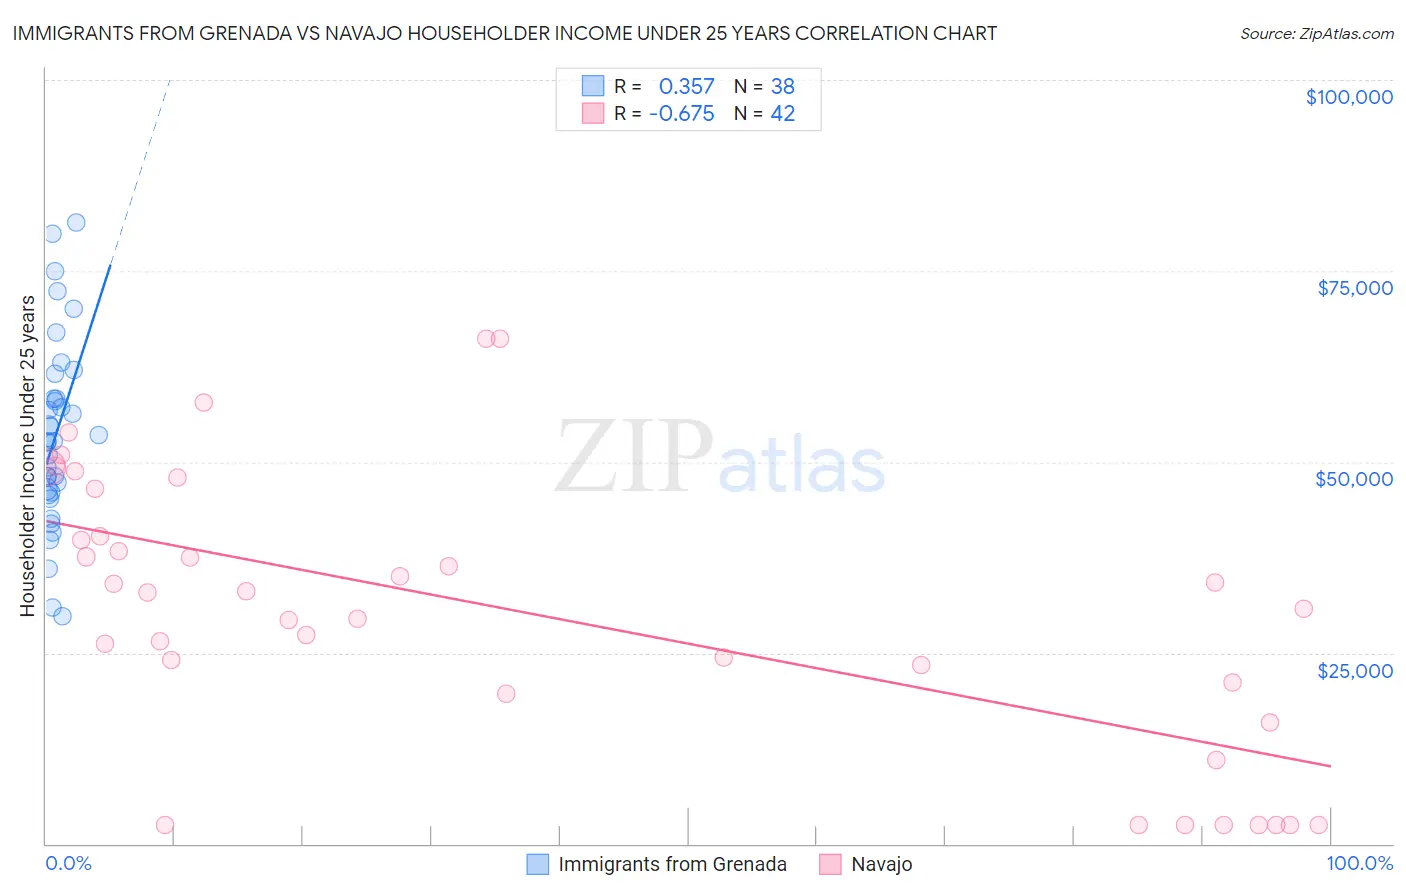
Immigrants from Grenada vs Navajo Householder Income Under 25 years Correlation Chart
The statistical analysis conducted on geographies consisting of 61,114,075 people shows a mild positive correlation between the proportion of Immigrants from Grenada and household income with householder under the age of 25 in the United States with a correlation coefficient (R) of 0.357 and weighted average of $54,538. Similarly, the statistical analysis conducted on geographies consisting of 204,469,211 people shows a significant negative correlation between the proportion of Navajo and household income with householder under the age of 25 in the United States with a correlation coefficient (R) of -0.675 and weighted average of $42,380, a difference of 28.7%.
Householder Income Under 25 years Correlation Summary
| Measurement | Immigrants from Grenada | Navajo |
| Minimum | $29,811 | $2,499 |
| Maximum | $81,354 | $66,100 |
| Range | $51,543 | $63,601 |
| Mean | $53,537 | $30,108 |
| Median | $52,711 | $31,821 |
| Interquartile 25% (IQ1) | $45,979 | $19,702 |
| Interquartile 75% (IQ3) | $58,278 | $40,321 |
| Interquartile Range (IQR) | $12,299 | $20,619 |
| Standard Deviation (Sample) | $12,149 | $18,160 |
| Standard Deviation (Population) | $11,988 | $17,943 |
Similar Demographics by Householder Income Under 25 years
Demographics Similar to Immigrants from Grenada by Householder Income Under 25 years
In terms of householder income under 25 years, the demographic groups most similar to Immigrants from Grenada are Macedonian ($54,563, a difference of 0.050%), Immigrants from Sri Lanka ($54,512, a difference of 0.050%), Immigrants from Northern Europe ($54,571, a difference of 0.060%), Immigrants from Brazil ($54,487, a difference of 0.090%), and Immigrants from Morocco ($54,593, a difference of 0.10%).
| Demographics | Rating | Rank | Householder Income Under 25 years |
| Okinawans | 99.8 /100 | #67 | Exceptional $54,701 |
| Tsimshian | 99.8 /100 | #68 | Exceptional $54,649 |
| Samoans | 99.7 /100 | #69 | Exceptional $54,610 |
| Immigrants | El Salvador | 99.7 /100 | #70 | Exceptional $54,599 |
| Immigrants | Morocco | 99.7 /100 | #71 | Exceptional $54,593 |
| Immigrants | Northern Europe | 99.7 /100 | #72 | Exceptional $54,571 |
| Macedonians | 99.7 /100 | #73 | Exceptional $54,563 |
| Immigrants | Grenada | 99.7 /100 | #74 | Exceptional $54,538 |
| Immigrants | Sri Lanka | 99.7 /100 | #75 | Exceptional $54,512 |
| Immigrants | Brazil | 99.6 /100 | #76 | Exceptional $54,487 |
| Immigrants | Southern Europe | 99.6 /100 | #77 | Exceptional $54,484 |
| Nepalese | 99.6 /100 | #78 | Exceptional $54,472 |
| Immigrants | Italy | 99.6 /100 | #79 | Exceptional $54,449 |
| Egyptians | 99.6 /100 | #80 | Exceptional $54,444 |
| Portuguese | 99.6 /100 | #81 | Exceptional $54,436 |
Demographics Similar to Navajo by Householder Income Under 25 years
In terms of householder income under 25 years, the demographic groups most similar to Navajo are Immigrants from Congo ($43,266, a difference of 2.1%), Immigrants from Yemen ($43,591, a difference of 2.9%), Arapaho ($44,003, a difference of 3.8%), Houma ($44,356, a difference of 4.7%), and Black/African American ($44,381, a difference of 4.7%).
| Demographics | Rating | Rank | Householder Income Under 25 years |
| Creek | 0.0 /100 | #333 | Tragic $45,371 |
| Cajuns | 0.0 /100 | #334 | Tragic $45,338 |
| Cheyenne | 0.0 /100 | #335 | Tragic $45,275 |
| Tohono O'odham | 0.0 /100 | #336 | Tragic $45,248 |
| Pueblo | 0.0 /100 | #337 | Tragic $45,018 |
| Chickasaw | 0.0 /100 | #338 | Tragic $44,763 |
| Kiowa | 0.0 /100 | #339 | Tragic $44,733 |
| Blacks/African Americans | 0.0 /100 | #340 | Tragic $44,381 |
| Houma | 0.0 /100 | #341 | Tragic $44,356 |
| Arapaho | 0.0 /100 | #342 | Tragic $44,003 |
| Immigrants | Yemen | 0.0 /100 | #343 | Tragic $43,591 |
| Immigrants | Congo | 0.0 /100 | #344 | Tragic $43,266 |
| Navajo | 0.0 /100 | #345 | Tragic $42,380 |
| Puerto Ricans | 0.0 /100 | #346 | Tragic $39,726 |
| Lumbee | 0.0 /100 | #347 | Tragic $34,584 |