Aleut vs Navajo In Labor Force | Age 30-34
COMPARE
Aleut
Navajo
In Labor Force | Age 30-34
In Labor Force | Age 30-34 Comparison
Aleuts
Navajo
82.6%
IN LABOR FORCE | AGE 30-34
0.0/ 100
METRIC RATING
298th/ 347
METRIC RANK
73.8%
IN LABOR FORCE | AGE 30-34
0.0/ 100
METRIC RATING
347th/ 347
METRIC RANK
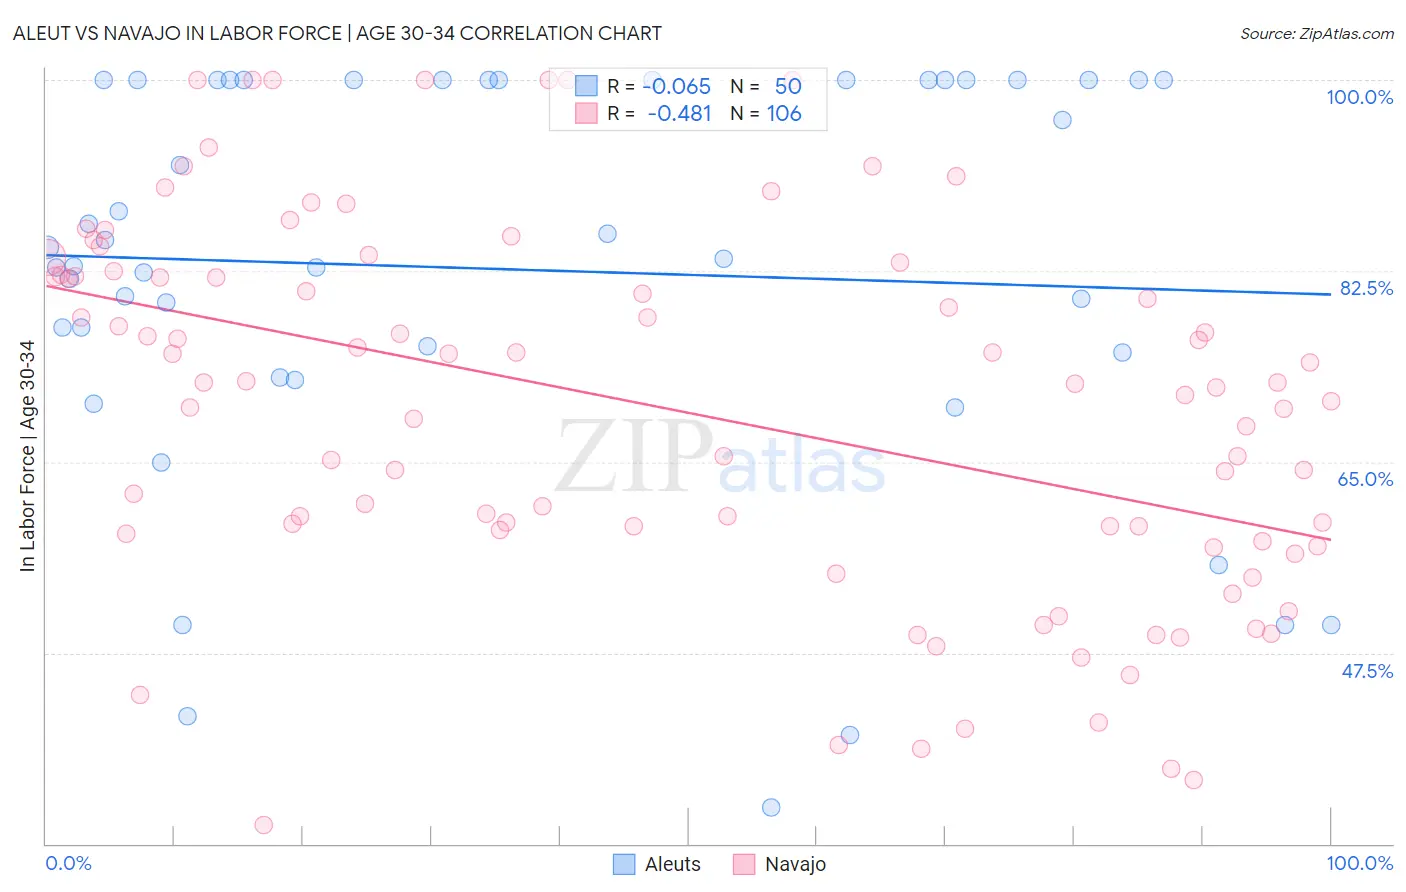
Aleut vs Navajo In Labor Force | Age 30-34 Correlation Chart
The statistical analysis conducted on geographies consisting of 61,771,589 people shows a slight negative correlation between the proportion of Aleuts and labor force participation rate among population between the ages 30 and 34 in the United States with a correlation coefficient (R) of -0.065 and weighted average of 82.6%. Similarly, the statistical analysis conducted on geographies consisting of 224,771,118 people shows a moderate negative correlation between the proportion of Navajo and labor force participation rate among population between the ages 30 and 34 in the United States with a correlation coefficient (R) of -0.481 and weighted average of 73.8%, a difference of 12.0%.
In Labor Force | Age 30-34 Correlation Summary
| Measurement | Aleut | Navajo |
| Minimum | 33.3% | 31.7% |
| Maximum | 100.0% | 100.0% |
| Range | 66.7% | 68.3% |
| Mean | 82.6% | 69.8% |
| Median | 84.1% | 72.0% |
| Interquartile 25% (IQ1) | 75.0% | 58.5% |
| Interquartile 75% (IQ3) | 100.0% | 82.0% |
| Interquartile Range (IQR) | 25.0% | 23.6% |
| Standard Deviation (Sample) | 18.4% | 16.9% |
| Standard Deviation (Population) | 18.2% | 16.8% |
Similar Demographics by In Labor Force | Age 30-34
Demographics Similar to Aleuts by In Labor Force | Age 30-34
In terms of in labor force | age 30-34, the demographic groups most similar to Aleuts are Comanche (82.6%, a difference of 0.0%), Chippewa (82.6%, a difference of 0.010%), Pennsylvania German (82.6%, a difference of 0.030%), Immigrants from Central America (82.5%, a difference of 0.13%), and American (82.7%, a difference of 0.15%).
| Demographics | Rating | Rank | In Labor Force | Age 30-34 |
| Potawatomi | 0.0 /100 | #291 | Tragic 82.8% |
| Blacks/African Americans | 0.0 /100 | #292 | Tragic 82.8% |
| Nepalese | 0.0 /100 | #293 | Tragic 82.7% |
| Americans | 0.0 /100 | #294 | Tragic 82.7% |
| Pennsylvania Germans | 0.0 /100 | #295 | Tragic 82.6% |
| Chippewa | 0.0 /100 | #296 | Tragic 82.6% |
| Comanche | 0.0 /100 | #297 | Tragic 82.6% |
| Aleuts | 0.0 /100 | #298 | Tragic 82.6% |
| Immigrants | Central America | 0.0 /100 | #299 | Tragic 82.5% |
| Hmong | 0.0 /100 | #300 | Tragic 82.4% |
| Hispanics or Latinos | 0.0 /100 | #301 | Tragic 82.4% |
| Ottawa | 0.0 /100 | #302 | Tragic 82.4% |
| Immigrants | Micronesia | 0.0 /100 | #303 | Tragic 82.4% |
| Tlingit-Haida | 0.0 /100 | #304 | Tragic 82.3% |
| Osage | 0.0 /100 | #305 | Tragic 82.3% |
Demographics Similar to Navajo by In Labor Force | Age 30-34
In terms of in labor force | age 30-34, the demographic groups most similar to Navajo are Crow (75.9%, a difference of 2.9%), Yup'ik (76.4%, a difference of 3.6%), Yuman (77.1%, a difference of 4.5%), Lumbee (77.3%, a difference of 4.8%), and Tohono O'odham (77.7%, a difference of 5.4%).
| Demographics | Rating | Rank | In Labor Force | Age 30-34 |
| Inupiat | 0.0 /100 | #333 | Tragic 79.7% |
| Hopi | 0.0 /100 | #334 | Tragic 79.3% |
| Marshallese | 0.0 /100 | #335 | Tragic 79.2% |
| Natives/Alaskans | 0.0 /100 | #336 | Tragic 79.2% |
| Yakama | 0.0 /100 | #337 | Tragic 79.1% |
| Pima | 0.0 /100 | #338 | Tragic 79.0% |
| Apache | 0.0 /100 | #339 | Tragic 79.0% |
| Ute | 0.0 /100 | #340 | Tragic 78.9% |
| Immigrants | Yemen | 0.0 /100 | #341 | Tragic 78.2% |
| Tohono O'odham | 0.0 /100 | #342 | Tragic 77.7% |
| Lumbee | 0.0 /100 | #343 | Tragic 77.3% |
| Yuman | 0.0 /100 | #344 | Tragic 77.1% |
| Yup'ik | 0.0 /100 | #345 | Tragic 76.4% |
| Crow | 0.0 /100 | #346 | Tragic 75.9% |
| Navajo | 0.0 /100 | #347 | Tragic 73.8% |