Trinidadian and Tobagonian vs Senegalese Median Male Earnings
COMPARE
Trinidadian and Tobagonian
Senegalese
Median Male Earnings
Median Male Earnings Comparison
Trinidadians and Tobagonians
Senegalese
$51,446
MEDIAN MALE EARNINGS
4.8/ 100
METRIC RATING
227th/ 347
METRIC RANK
$49,774
MEDIAN MALE EARNINGS
1.0/ 100
METRIC RATING
254th/ 347
METRIC RANK
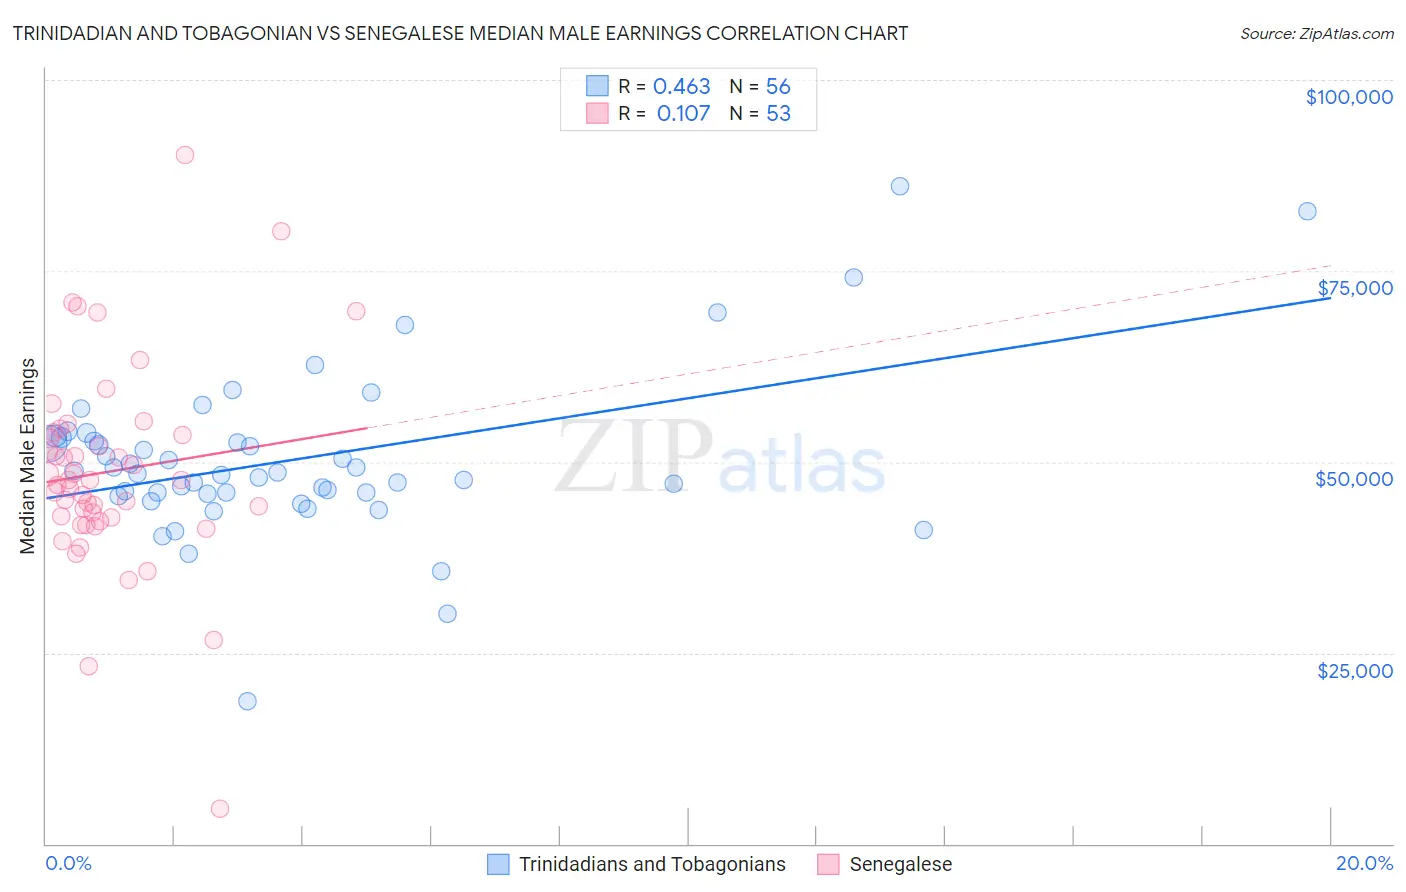
Trinidadian and Tobagonian vs Senegalese Median Male Earnings Correlation Chart
The statistical analysis conducted on geographies consisting of 219,852,286 people shows a moderate positive correlation between the proportion of Trinidadians and Tobagonians and median male earnings in the United States with a correlation coefficient (R) of 0.463 and weighted average of $51,446. Similarly, the statistical analysis conducted on geographies consisting of 78,104,359 people shows a poor positive correlation between the proportion of Senegalese and median male earnings in the United States with a correlation coefficient (R) of 0.107 and weighted average of $49,774, a difference of 3.4%.
Median Male Earnings Correlation Summary
| Measurement | Trinidadian and Tobagonian | Senegalese |
| Minimum | $18,666 | $4,513 |
| Maximum | $86,046 | $90,259 |
| Range | $67,380 | $85,746 |
| Mean | $50,279 | $48,737 |
| Median | $48,562 | $47,653 |
| Interquartile 25% (IQ1) | $45,885 | $42,459 |
| Interquartile 75% (IQ3) | $52,942 | $53,697 |
| Interquartile Range (IQR) | $7,058 | $11,239 |
| Standard Deviation (Sample) | $10,888 | $13,453 |
| Standard Deviation (Population) | $10,790 | $13,326 |
Similar Demographics by Median Male Earnings
Demographics Similar to Trinidadians and Tobagonians by Median Male Earnings
In terms of median male earnings, the demographic groups most similar to Trinidadians and Tobagonians are Japanese ($51,473, a difference of 0.050%), Immigrants from Sudan ($51,489, a difference of 0.080%), Samoan ($51,389, a difference of 0.11%), Immigrants from Trinidad and Tobago ($51,376, a difference of 0.14%), and Immigrants from Nigeria ($51,310, a difference of 0.27%).
| Demographics | Rating | Rank | Median Male Earnings |
| Immigrants | Armenia | 6.6 /100 | #220 | Tragic $51,793 |
| Immigrants | Senegal | 5.8 /100 | #221 | Tragic $51,647 |
| Immigrants | Bangladesh | 5.8 /100 | #222 | Tragic $51,642 |
| Ecuadorians | 5.5 /100 | #223 | Tragic $51,596 |
| Immigrants | Cambodia | 5.5 /100 | #224 | Tragic $51,594 |
| Immigrants | Sudan | 5.0 /100 | #225 | Tragic $51,489 |
| Japanese | 4.9 /100 | #226 | Tragic $51,473 |
| Trinidadians and Tobagonians | 4.8 /100 | #227 | Tragic $51,446 |
| Samoans | 4.6 /100 | #228 | Tragic $51,389 |
| Immigrants | Trinidad and Tobago | 4.5 /100 | #229 | Tragic $51,376 |
| Immigrants | Nigeria | 4.2 /100 | #230 | Tragic $51,310 |
| Barbadians | 3.9 /100 | #231 | Tragic $51,236 |
| Sudanese | 3.9 /100 | #232 | Tragic $51,216 |
| Aleuts | 3.7 /100 | #233 | Tragic $51,168 |
| Cape Verdeans | 3.5 /100 | #234 | Tragic $51,103 |
Demographics Similar to Senegalese by Median Male Earnings
In terms of median male earnings, the demographic groups most similar to Senegalese are Alaskan Athabascan ($49,748, a difference of 0.050%), Alaska Native ($49,711, a difference of 0.13%), British West Indian ($49,636, a difference of 0.28%), German Russian ($49,924, a difference of 0.30%), and Immigrants from Cabo Verde ($50,009, a difference of 0.47%).
| Demographics | Rating | Rank | Median Male Earnings |
| Sub-Saharan Africans | 1.8 /100 | #247 | Tragic $50,408 |
| Immigrants | Guyana | 1.6 /100 | #248 | Tragic $50,321 |
| Immigrants | Burma/Myanmar | 1.6 /100 | #249 | Tragic $50,298 |
| Osage | 1.6 /100 | #250 | Tragic $50,292 |
| Immigrants | Grenada | 1.6 /100 | #251 | Tragic $50,279 |
| Immigrants | Cabo Verde | 1.2 /100 | #252 | Tragic $50,009 |
| German Russians | 1.1 /100 | #253 | Tragic $49,924 |
| Senegalese | 1.0 /100 | #254 | Tragic $49,774 |
| Alaskan Athabascans | 0.9 /100 | #255 | Tragic $49,748 |
| Alaska Natives | 0.9 /100 | #256 | Tragic $49,711 |
| British West Indians | 0.8 /100 | #257 | Tragic $49,636 |
| Cree | 0.7 /100 | #258 | Tragic $49,497 |
| Nepalese | 0.7 /100 | #259 | Tragic $49,458 |
| Iroquois | 0.7 /100 | #260 | Tragic $49,374 |
| Liberians | 0.6 /100 | #261 | Tragic $49,318 |