English vs Immigrants from Uganda Median Female Earnings
COMPARE
English
Immigrants from Uganda
Median Female Earnings
Median Female Earnings Comparison
English
Immigrants from Uganda
$38,196
MEDIAN FEMALE EARNINGS
4.2/ 100
METRIC RATING
239th/ 347
METRIC RANK
$40,739
MEDIAN FEMALE EARNINGS
89.7/ 100
METRIC RATING
132nd/ 347
METRIC RANK
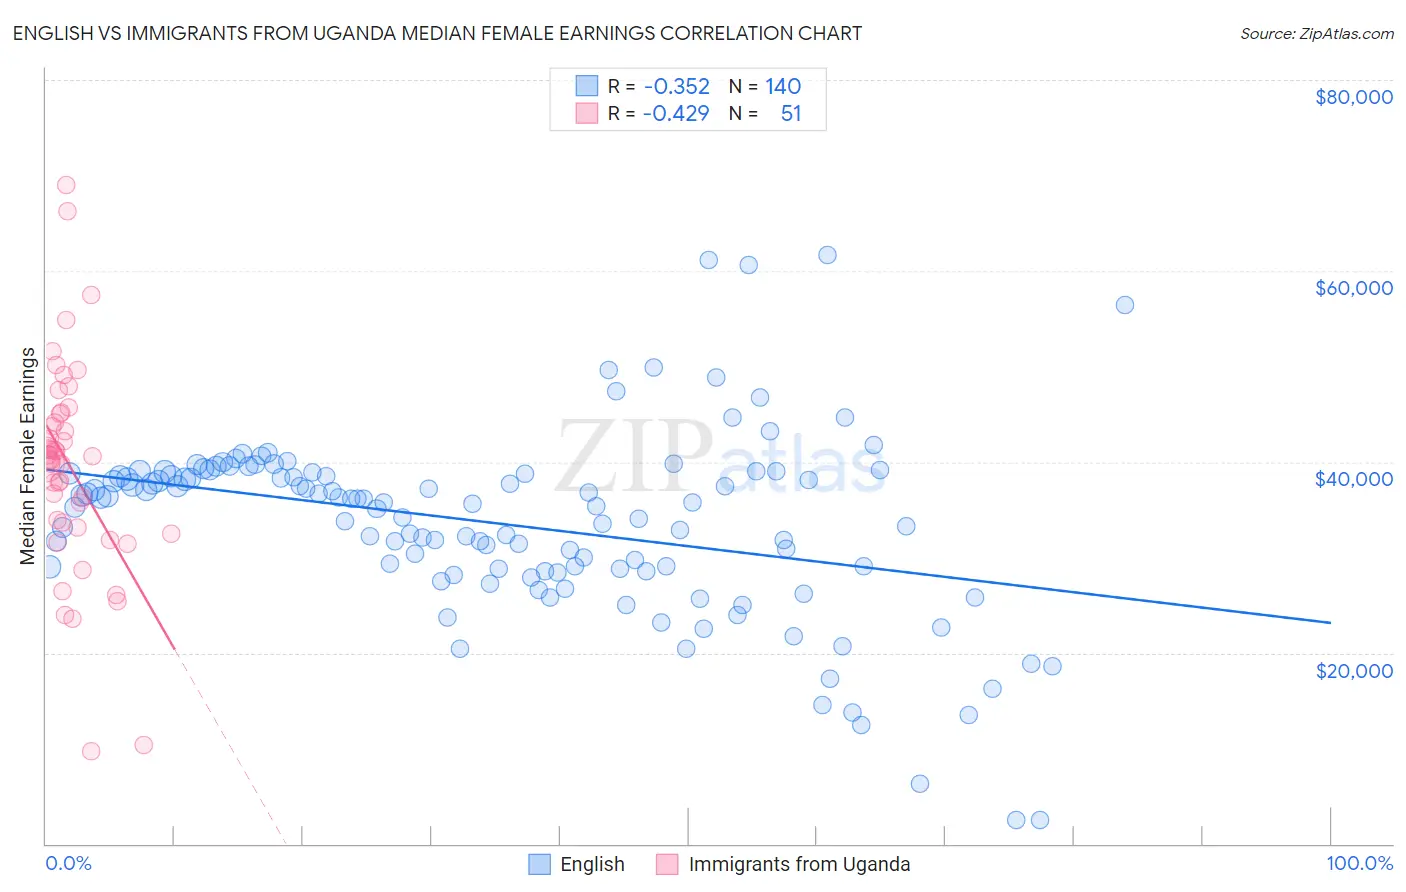
English vs Immigrants from Uganda Median Female Earnings Correlation Chart
The statistical analysis conducted on geographies consisting of 577,154,042 people shows a mild negative correlation between the proportion of English and median female earnings in the United States with a correlation coefficient (R) of -0.352 and weighted average of $38,196. Similarly, the statistical analysis conducted on geographies consisting of 125,969,564 people shows a moderate negative correlation between the proportion of Immigrants from Uganda and median female earnings in the United States with a correlation coefficient (R) of -0.429 and weighted average of $40,739, a difference of 6.7%.
Median Female Earnings Correlation Summary
| Measurement | English | Immigrants from Uganda |
| Minimum | $2,499 | $9,732 |
| Maximum | $61,721 | $69,004 |
| Range | $59,222 | $59,272 |
| Mean | $33,482 | $39,368 |
| Median | $35,643 | $40,305 |
| Interquartile 25% (IQ1) | $28,708 | $33,173 |
| Interquartile 75% (IQ3) | $38,774 | $44,985 |
| Interquartile Range (IQR) | $10,066 | $11,812 |
| Standard Deviation (Sample) | $9,710 | $11,139 |
| Standard Deviation (Population) | $9,675 | $11,029 |
Similar Demographics by Median Female Earnings
Demographics Similar to English by Median Female Earnings
In terms of median female earnings, the demographic groups most similar to English are Alaska Native ($38,202, a difference of 0.020%), Immigrants from Cabo Verde ($38,208, a difference of 0.030%), Sudanese ($38,215, a difference of 0.050%), Liberian ($38,215, a difference of 0.050%), and Finnish ($38,173, a difference of 0.060%).
| Demographics | Rating | Rank | Median Female Earnings |
| Scandinavians | 5.2 /100 | #232 | Tragic $38,306 |
| Tongans | 5.1 /100 | #233 | Tragic $38,288 |
| Celtics | 5.0 /100 | #234 | Tragic $38,283 |
| Sudanese | 4.4 /100 | #235 | Tragic $38,215 |
| Liberians | 4.4 /100 | #236 | Tragic $38,215 |
| Immigrants | Cabo Verde | 4.3 /100 | #237 | Tragic $38,208 |
| Alaska Natives | 4.3 /100 | #238 | Tragic $38,202 |
| English | 4.2 /100 | #239 | Tragic $38,196 |
| Finns | 4.0 /100 | #240 | Tragic $38,173 |
| Spanish | 3.5 /100 | #241 | Tragic $38,098 |
| Immigrants | Burma/Myanmar | 3.0 /100 | #242 | Tragic $38,028 |
| Germans | 2.8 /100 | #243 | Tragic $37,986 |
| Immigrants | Liberia | 2.7 /100 | #244 | Tragic $37,970 |
| Immigrants | Middle Africa | 2.7 /100 | #245 | Tragic $37,965 |
| Delaware | 2.6 /100 | #246 | Tragic $37,964 |
Demographics Similar to Immigrants from Uganda by Median Female Earnings
In terms of median female earnings, the demographic groups most similar to Immigrants from Uganda are Syrian ($40,727, a difference of 0.030%), Chilean ($40,757, a difference of 0.040%), Arab ($40,718, a difference of 0.050%), Immigrants from Guyana ($40,773, a difference of 0.080%), and Immigrants from Nepal ($40,704, a difference of 0.090%).
| Demographics | Rating | Rank | Median Female Earnings |
| Austrians | 92.7 /100 | #125 | Exceptional $40,923 |
| Immigrants | Trinidad and Tobago | 92.3 /100 | #126 | Exceptional $40,895 |
| Ugandans | 92.2 /100 | #127 | Exceptional $40,889 |
| Carpatho Rusyns | 91.2 /100 | #128 | Exceptional $40,825 |
| Zimbabweans | 90.8 /100 | #129 | Exceptional $40,798 |
| Immigrants | Guyana | 90.3 /100 | #130 | Exceptional $40,773 |
| Chileans | 90.0 /100 | #131 | Exceptional $40,757 |
| Immigrants | Uganda | 89.7 /100 | #132 | Excellent $40,739 |
| Syrians | 89.5 /100 | #133 | Excellent $40,727 |
| Arabs | 89.3 /100 | #134 | Excellent $40,718 |
| Immigrants | Nepal | 89.0 /100 | #135 | Excellent $40,704 |
| Immigrants | Eastern Africa | 87.7 /100 | #136 | Excellent $40,644 |
| Pakistanis | 86.6 /100 | #137 | Excellent $40,596 |
| Taiwanese | 86.1 /100 | #138 | Excellent $40,576 |
| Immigrants | South Eastern Asia | 85.7 /100 | #139 | Excellent $40,558 |