Alaskan Athabascan vs Albanian Median Female Earnings
COMPARE
Alaskan Athabascan
Albanian
Median Female Earnings
Median Female Earnings Comparison
Alaskan Athabascans
Albanians
$37,905
MEDIAN FEMALE EARNINGS
2.3/ 100
METRIC RATING
248th/ 347
METRIC RANK
$42,584
MEDIAN FEMALE EARNINGS
99.8/ 100
METRIC RATING
72nd/ 347
METRIC RANK
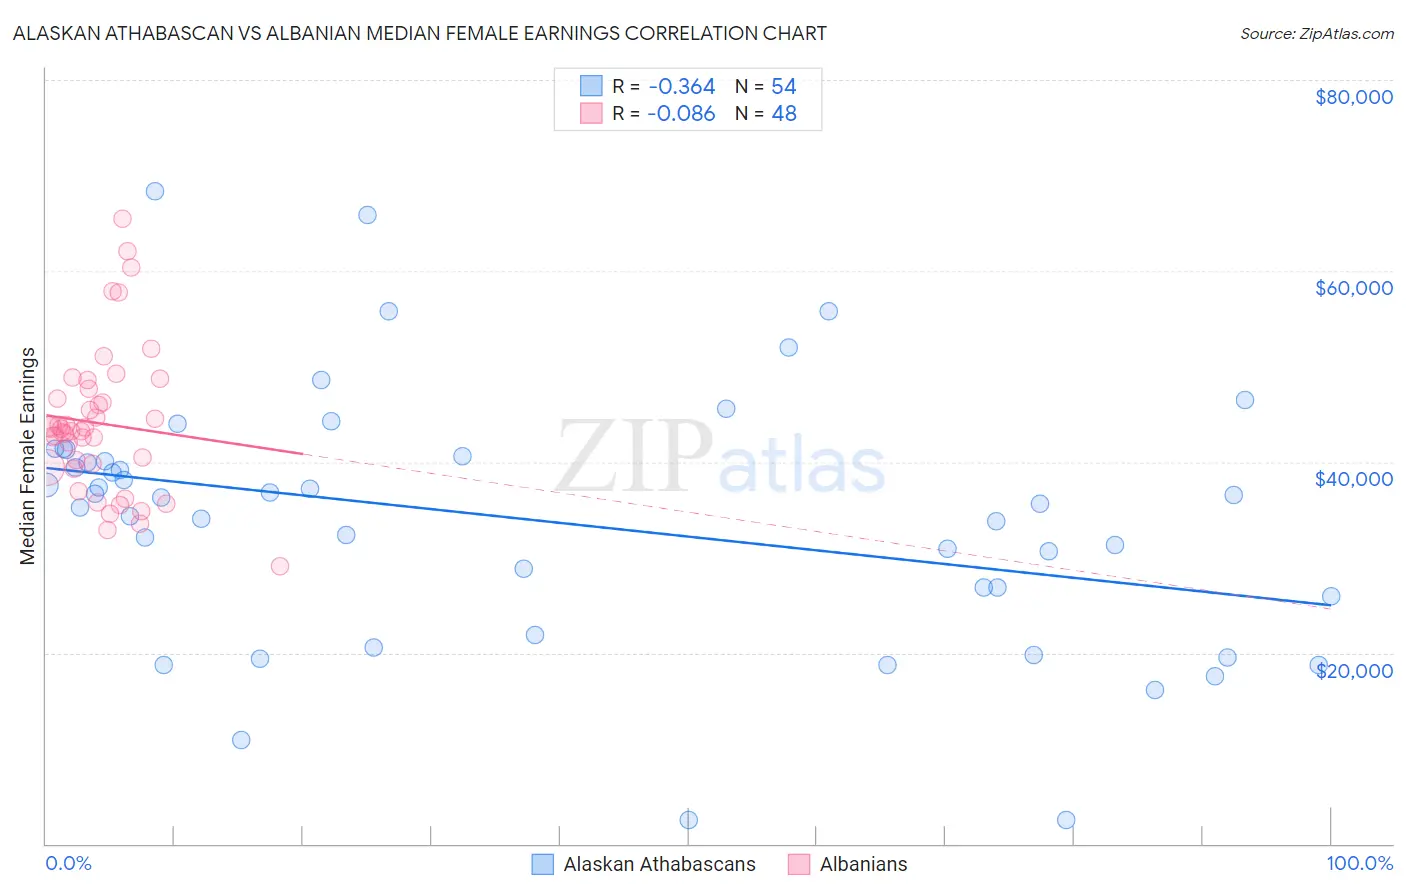
Alaskan Athabascan vs Albanian Median Female Earnings Correlation Chart
The statistical analysis conducted on geographies consisting of 45,800,514 people shows a mild negative correlation between the proportion of Alaskan Athabascans and median female earnings in the United States with a correlation coefficient (R) of -0.364 and weighted average of $37,905. Similarly, the statistical analysis conducted on geographies consisting of 193,224,752 people shows a slight negative correlation between the proportion of Albanians and median female earnings in the United States with a correlation coefficient (R) of -0.086 and weighted average of $42,584, a difference of 12.3%.
Median Female Earnings Correlation Summary
| Measurement | Alaskan Athabascan | Albanian |
| Minimum | $2,499 | $29,043 |
| Maximum | $68,290 | $65,406 |
| Range | $65,791 | $36,363 |
| Mean | $33,896 | $44,026 |
| Median | $35,954 | $43,361 |
| Interquartile 25% (IQ1) | $25,923 | $39,614 |
| Interquartile 75% (IQ3) | $40,625 | $47,094 |
| Interquartile Range (IQR) | $14,702 | $7,480 |
| Standard Deviation (Sample) | $13,459 | $7,618 |
| Standard Deviation (Population) | $13,333 | $7,538 |
Similar Demographics by Median Female Earnings
Demographics Similar to Alaskan Athabascans by Median Female Earnings
In terms of median female earnings, the demographic groups most similar to Alaskan Athabascans are Swiss ($37,904, a difference of 0.0%), Immigrants from Somalia ($37,914, a difference of 0.020%), Immigrants from Iraq ($37,864, a difference of 0.11%), Welsh ($37,856, a difference of 0.13%), and Immigrants from Middle Africa ($37,965, a difference of 0.16%).
| Demographics | Rating | Rank | Median Female Earnings |
| Spanish | 3.5 /100 | #241 | Tragic $38,098 |
| Immigrants | Burma/Myanmar | 3.0 /100 | #242 | Tragic $38,028 |
| Germans | 2.8 /100 | #243 | Tragic $37,986 |
| Immigrants | Liberia | 2.7 /100 | #244 | Tragic $37,970 |
| Immigrants | Middle Africa | 2.7 /100 | #245 | Tragic $37,965 |
| Delaware | 2.6 /100 | #246 | Tragic $37,964 |
| Immigrants | Somalia | 2.4 /100 | #247 | Tragic $37,914 |
| Alaskan Athabascans | 2.3 /100 | #248 | Tragic $37,905 |
| Swiss | 2.3 /100 | #249 | Tragic $37,904 |
| Immigrants | Iraq | 2.2 /100 | #250 | Tragic $37,864 |
| Welsh | 2.1 /100 | #251 | Tragic $37,856 |
| Immigrants | Dominica | 2.0 /100 | #252 | Tragic $37,825 |
| Danes | 1.6 /100 | #253 | Tragic $37,730 |
| Whites/Caucasians | 1.1 /100 | #254 | Tragic $37,531 |
| Colville | 1.1 /100 | #255 | Tragic $37,514 |
Demographics Similar to Albanians by Median Female Earnings
In terms of median female earnings, the demographic groups most similar to Albanians are Mongolian ($42,542, a difference of 0.10%), Immigrants from South Africa ($42,508, a difference of 0.18%), Immigrants from Romania ($42,718, a difference of 0.32%), New Zealander ($42,446, a difference of 0.32%), and Immigrants from Italy ($42,446, a difference of 0.33%).
| Demographics | Rating | Rank | Median Female Earnings |
| Sierra Leoneans | 99.9 /100 | #65 | Exceptional $42,868 |
| Immigrants | Norway | 99.9 /100 | #66 | Exceptional $42,837 |
| Immigrants | Egypt | 99.9 /100 | #67 | Exceptional $42,837 |
| Immigrants | Austria | 99.8 /100 | #68 | Exceptional $42,824 |
| Immigrants | Spain | 99.8 /100 | #69 | Exceptional $42,815 |
| Immigrants | Ethiopia | 99.8 /100 | #70 | Exceptional $42,744 |
| Immigrants | Romania | 99.8 /100 | #71 | Exceptional $42,718 |
| Albanians | 99.8 /100 | #72 | Exceptional $42,584 |
| Mongolians | 99.7 /100 | #73 | Exceptional $42,542 |
| Immigrants | South Africa | 99.7 /100 | #74 | Exceptional $42,508 |
| New Zealanders | 99.7 /100 | #75 | Exceptional $42,446 |
| Immigrants | Italy | 99.7 /100 | #76 | Exceptional $42,446 |
| Immigrants | Albania | 99.6 /100 | #77 | Exceptional $42,388 |
| Immigrants | Kazakhstan | 99.6 /100 | #78 | Exceptional $42,386 |
| Greeks | 99.6 /100 | #79 | Exceptional $42,336 |