Immigrants from North America vs Immigrants from Uganda Median Female Earnings
COMPARE
Immigrants from North America
Immigrants from Uganda
Median Female Earnings
Median Female Earnings Comparison
Immigrants from North America
Immigrants from Uganda
$41,319
MEDIAN FEMALE EARNINGS
96.7/ 100
METRIC RATING
112th/ 347
METRIC RANK
$40,739
MEDIAN FEMALE EARNINGS
89.7/ 100
METRIC RATING
132nd/ 347
METRIC RANK
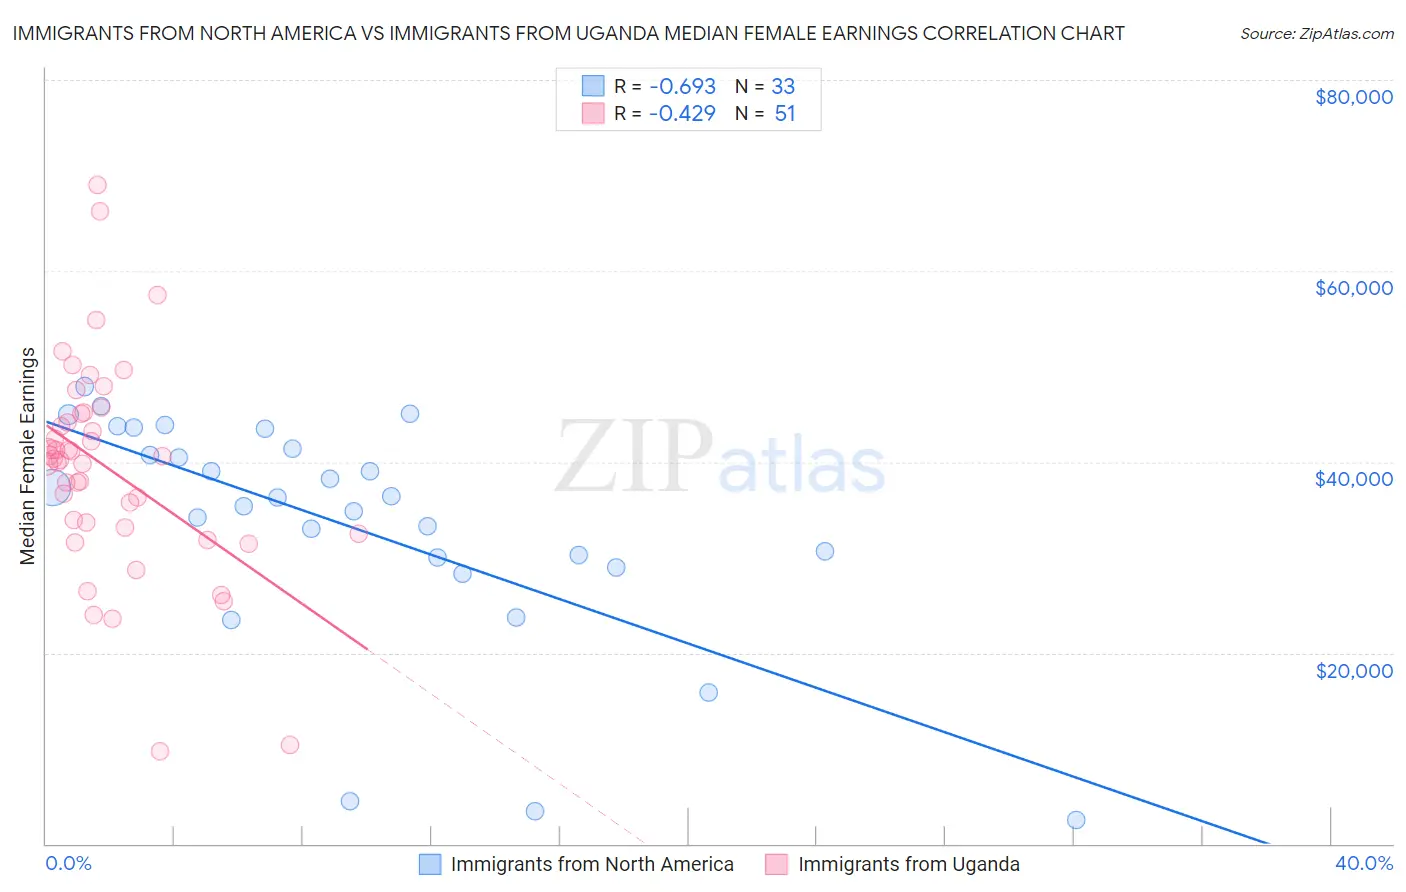
Immigrants from North America vs Immigrants from Uganda Median Female Earnings Correlation Chart
The statistical analysis conducted on geographies consisting of 462,086,595 people shows a significant negative correlation between the proportion of Immigrants from North America and median female earnings in the United States with a correlation coefficient (R) of -0.693 and weighted average of $41,319. Similarly, the statistical analysis conducted on geographies consisting of 125,969,564 people shows a moderate negative correlation between the proportion of Immigrants from Uganda and median female earnings in the United States with a correlation coefficient (R) of -0.429 and weighted average of $40,739, a difference of 1.4%.
Median Female Earnings Correlation Summary
| Measurement | Immigrants from North America | Immigrants from Uganda |
| Minimum | $2,499 | $9,732 |
| Maximum | $47,877 | $69,004 |
| Range | $45,378 | $59,272 |
| Mean | $33,312 | $39,368 |
| Median | $36,283 | $40,305 |
| Interquartile 25% (IQ1) | $29,495 | $33,173 |
| Interquartile 75% (IQ3) | $42,384 | $44,985 |
| Interquartile Range (IQR) | $12,888 | $11,812 |
| Standard Deviation (Sample) | $12,008 | $11,139 |
| Standard Deviation (Population) | $11,825 | $11,029 |
Demographics Similar to Immigrants from North America and Immigrants from Uganda by Median Female Earnings
In terms of median female earnings, the demographic groups most similar to Immigrants from North America are Macedonian ($41,286, a difference of 0.080%), Immigrants from England ($41,277, a difference of 0.10%), Korean ($41,276, a difference of 0.10%), Immigrants from Brazil ($41,273, a difference of 0.11%), and Barbadian ($41,261, a difference of 0.14%). Similarly, the demographic groups most similar to Immigrants from Uganda are Chilean ($40,757, a difference of 0.040%), Immigrants from Guyana ($40,773, a difference of 0.080%), Zimbabwean ($40,798, a difference of 0.14%), Carpatho Rusyn ($40,825, a difference of 0.21%), and Ugandan ($40,889, a difference of 0.37%).
| Demographics | Rating | Rank | Median Female Earnings |
| Immigrants | North America | 96.7 /100 | #112 | Exceptional $41,319 |
| Macedonians | 96.4 /100 | #113 | Exceptional $41,286 |
| Immigrants | England | 96.4 /100 | #114 | Exceptional $41,277 |
| Koreans | 96.4 /100 | #115 | Exceptional $41,276 |
| Immigrants | Brazil | 96.4 /100 | #116 | Exceptional $41,273 |
| Barbadians | 96.3 /100 | #117 | Exceptional $41,261 |
| Immigrants | Lebanon | 95.6 /100 | #118 | Exceptional $41,183 |
| Immigrants | Philippines | 95.0 /100 | #119 | Exceptional $41,114 |
| Immigrants | Kuwait | 94.4 /100 | #120 | Exceptional $41,055 |
| Croatians | 93.7 /100 | #121 | Exceptional $40,993 |
| Immigrants | Jordan | 93.5 /100 | #122 | Exceptional $40,977 |
| Guyanese | 93.4 /100 | #123 | Exceptional $40,973 |
| Trinidadians and Tobagonians | 93.2 /100 | #124 | Exceptional $40,958 |
| Austrians | 92.7 /100 | #125 | Exceptional $40,923 |
| Immigrants | Trinidad and Tobago | 92.3 /100 | #126 | Exceptional $40,895 |
| Ugandans | 92.2 /100 | #127 | Exceptional $40,889 |
| Carpatho Rusyns | 91.2 /100 | #128 | Exceptional $40,825 |
| Zimbabweans | 90.8 /100 | #129 | Exceptional $40,798 |
| Immigrants | Guyana | 90.3 /100 | #130 | Exceptional $40,773 |
| Chileans | 90.0 /100 | #131 | Exceptional $40,757 |
| Immigrants | Uganda | 89.7 /100 | #132 | Excellent $40,739 |