Alaskan Athabascan vs Cuban Householder Income Ages 25 - 44 years
COMPARE
Alaskan Athabascan
Cuban
Householder Income Ages 25 - 44 years
Householder Income Ages 25 - 44 years Comparison
Alaskan Athabascans
Cubans
$88,446
HOUSEHOLDER INCOME AGES 25 - 44 YEARS
3.3/ 100
METRIC RATING
230th/ 347
METRIC RANK
$81,483
HOUSEHOLDER INCOME AGES 25 - 44 YEARS
0.1/ 100
METRIC RATING
294th/ 347
METRIC RANK
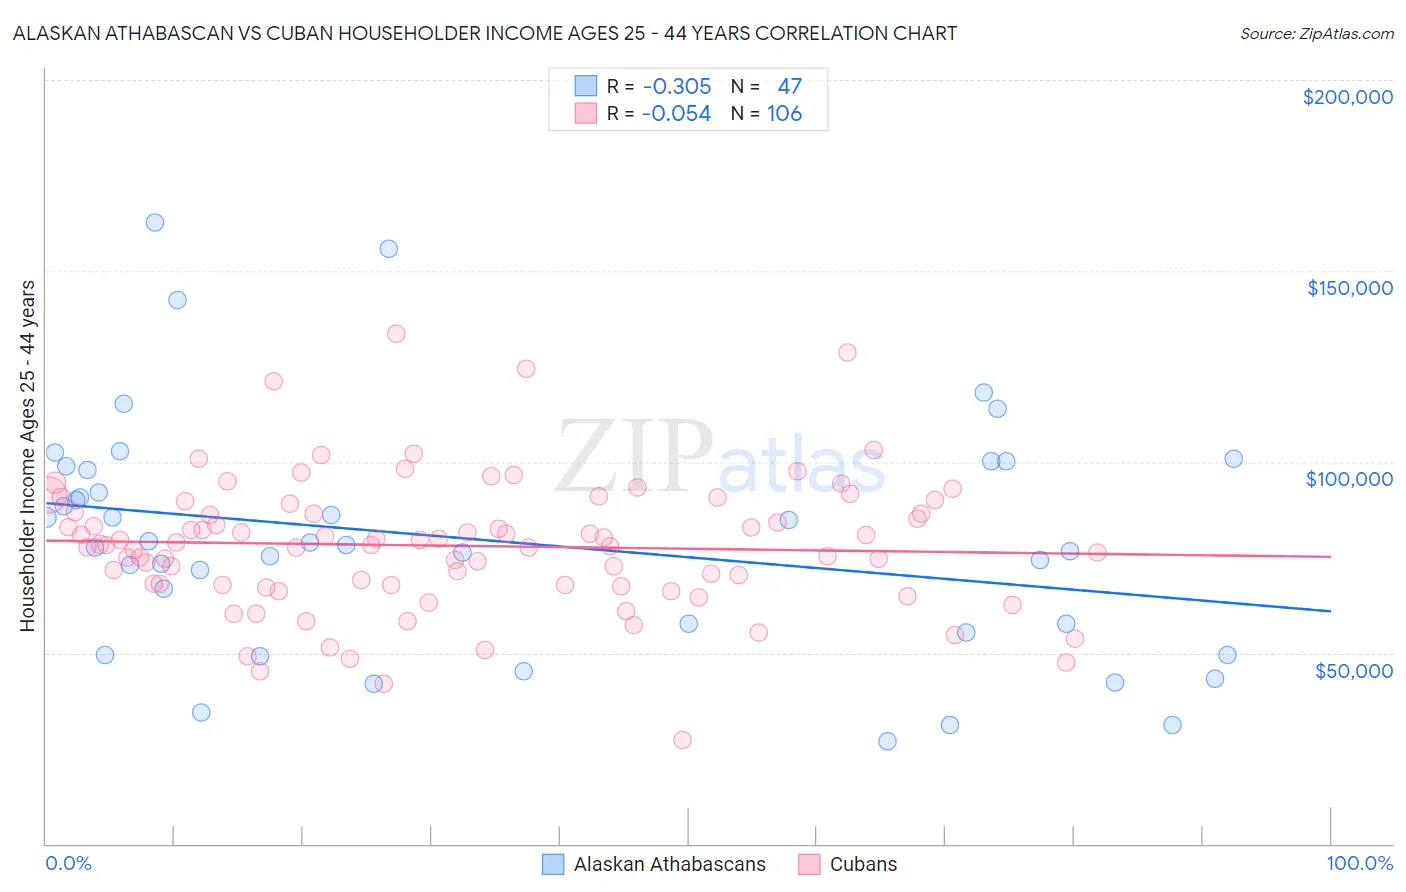
Alaskan Athabascan vs Cuban Householder Income Ages 25 - 44 years Correlation Chart
The statistical analysis conducted on geographies consisting of 45,791,396 people shows a mild negative correlation between the proportion of Alaskan Athabascans and household income with householder between the ages 25 and 44 in the United States with a correlation coefficient (R) of -0.305 and weighted average of $88,446. Similarly, the statistical analysis conducted on geographies consisting of 447,656,503 people shows a slight negative correlation between the proportion of Cubans and household income with householder between the ages 25 and 44 in the United States with a correlation coefficient (R) of -0.054 and weighted average of $81,483, a difference of 8.6%.
Householder Income Ages 25 - 44 years Correlation Summary
| Measurement | Alaskan Athabascan | Cuban |
| Minimum | $26,875 | $27,125 |
| Maximum | $162,636 | $133,668 |
| Range | $135,761 | $106,543 |
| Mean | $79,344 | $78,016 |
| Median | $78,125 | $78,321 |
| Interquartile 25% (IQ1) | $55,208 | $67,806 |
| Interquartile 75% (IQ3) | $98,910 | $86,783 |
| Interquartile Range (IQR) | $43,702 | $18,977 |
| Standard Deviation (Sample) | $30,855 | $17,466 |
| Standard Deviation (Population) | $30,525 | $17,384 |
Similar Demographics by Householder Income Ages 25 - 44 years
Demographics Similar to Alaskan Athabascans by Householder Income Ages 25 - 44 years
In terms of householder income ages 25 - 44 years, the demographic groups most similar to Alaskan Athabascans are Immigrants from Grenada ($88,311, a difference of 0.15%), Nonimmigrants ($88,301, a difference of 0.16%), Malaysian ($88,291, a difference of 0.18%), Venezuelan ($88,232, a difference of 0.24%), and Bermudan ($88,231, a difference of 0.24%).
| Demographics | Rating | Rank | Householder Income Ages 25 - 44 years |
| Immigrants | Guyana | 5.9 /100 | #223 | Tragic $89,586 |
| Barbadians | 5.9 /100 | #224 | Tragic $89,565 |
| Immigrants | Panama | 5.5 /100 | #225 | Tragic $89,451 |
| Immigrants | Iraq | 5.5 /100 | #226 | Tragic $89,444 |
| Immigrants | St. Vincent and the Grenadines | 4.1 /100 | #227 | Tragic $88,888 |
| Immigrants | Bosnia and Herzegovina | 4.0 /100 | #228 | Tragic $88,819 |
| Immigrants | Barbados | 3.7 /100 | #229 | Tragic $88,687 |
| Alaskan Athabascans | 3.3 /100 | #230 | Tragic $88,446 |
| Immigrants | Grenada | 3.0 /100 | #231 | Tragic $88,311 |
| Immigrants | Nonimmigrants | 3.0 /100 | #232 | Tragic $88,301 |
| Malaysians | 3.0 /100 | #233 | Tragic $88,291 |
| Venezuelans | 2.9 /100 | #234 | Tragic $88,232 |
| Bermudans | 2.9 /100 | #235 | Tragic $88,231 |
| Immigrants | Cameroon | 2.9 /100 | #236 | Tragic $88,214 |
| Salvadorans | 2.8 /100 | #237 | Tragic $88,198 |
Demographics Similar to Cubans by Householder Income Ages 25 - 44 years
In terms of householder income ages 25 - 44 years, the demographic groups most similar to Cubans are Blackfeet ($81,531, a difference of 0.060%), Bangladeshi ($81,363, a difference of 0.15%), Immigrants from Dominica ($81,351, a difference of 0.16%), Immigrants from Guatemala ($81,341, a difference of 0.17%), and Yaqui ($81,656, a difference of 0.21%).
| Demographics | Rating | Rank | Householder Income Ages 25 - 44 years |
| Immigrants | Latin America | 0.1 /100 | #287 | Tragic $82,166 |
| Comanche | 0.1 /100 | #288 | Tragic $82,152 |
| Shoshone | 0.1 /100 | #289 | Tragic $82,062 |
| Liberians | 0.1 /100 | #290 | Tragic $82,005 |
| Potawatomi | 0.1 /100 | #291 | Tragic $81,774 |
| Yaqui | 0.1 /100 | #292 | Tragic $81,656 |
| Blackfeet | 0.1 /100 | #293 | Tragic $81,531 |
| Cubans | 0.1 /100 | #294 | Tragic $81,483 |
| Bangladeshis | 0.1 /100 | #295 | Tragic $81,363 |
| Immigrants | Dominica | 0.1 /100 | #296 | Tragic $81,351 |
| Immigrants | Guatemala | 0.1 /100 | #297 | Tragic $81,341 |
| Dominicans | 0.1 /100 | #298 | Tragic $81,229 |
| Immigrants | Liberia | 0.1 /100 | #299 | Tragic $80,863 |
| Cherokee | 0.0 /100 | #300 | Tragic $80,843 |
| Immigrants | Micronesia | 0.0 /100 | #301 | Tragic $80,544 |