Marshallese vs Cuban Householder Income Ages 25 - 44 years
COMPARE
Marshallese
Cuban
Householder Income Ages 25 - 44 years
Householder Income Ages 25 - 44 years Comparison
Marshallese
Cubans
$83,575
HOUSEHOLDER INCOME AGES 25 - 44 YEARS
0.2/ 100
METRIC RATING
274th/ 347
METRIC RANK
$81,483
HOUSEHOLDER INCOME AGES 25 - 44 YEARS
0.1/ 100
METRIC RATING
294th/ 347
METRIC RANK
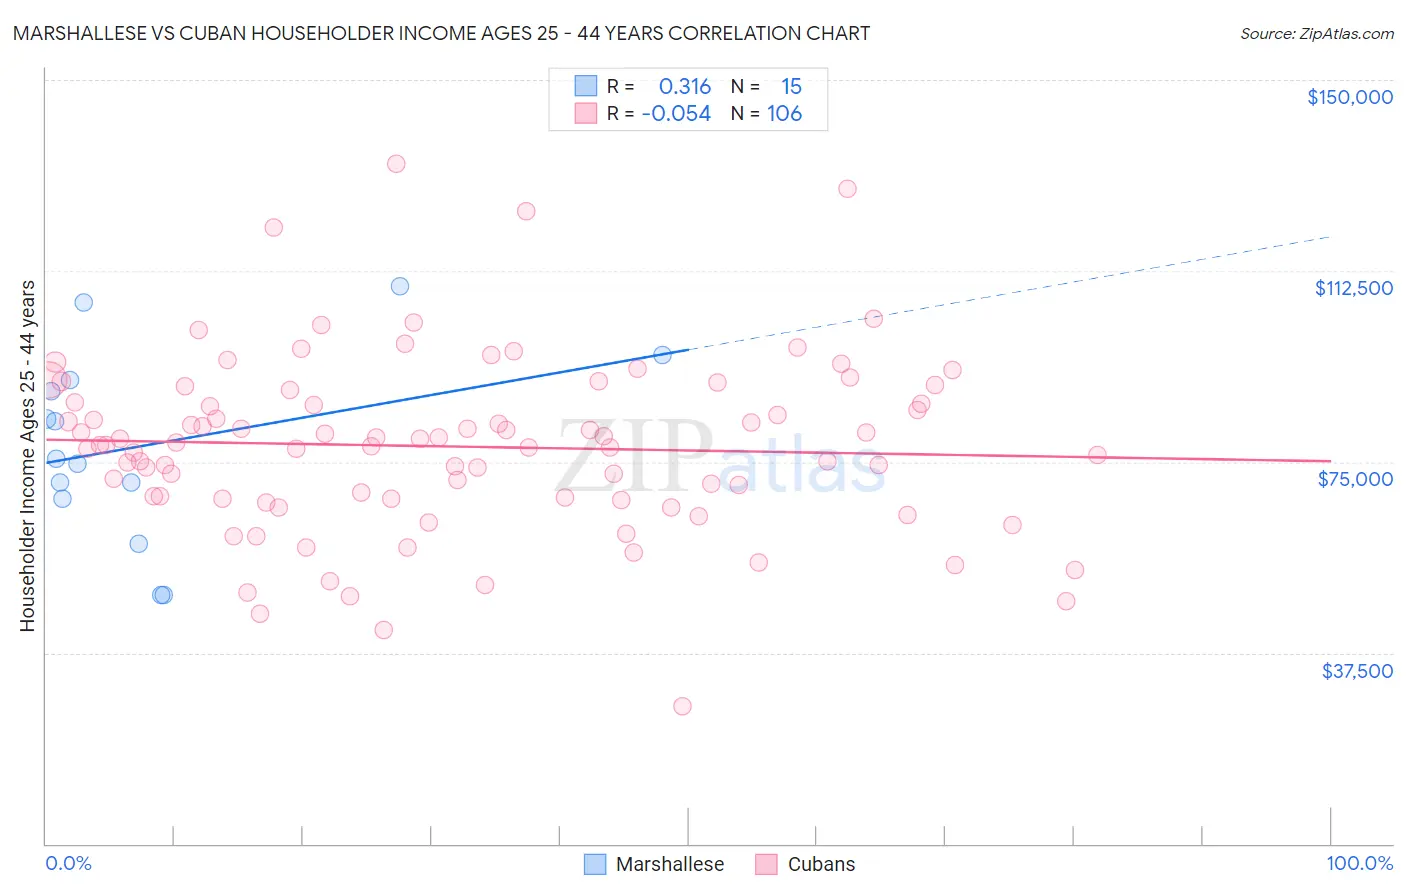
Marshallese vs Cuban Householder Income Ages 25 - 44 years Correlation Chart
The statistical analysis conducted on geographies consisting of 14,753,881 people shows a mild positive correlation between the proportion of Marshallese and household income with householder between the ages 25 and 44 in the United States with a correlation coefficient (R) of 0.316 and weighted average of $83,575. Similarly, the statistical analysis conducted on geographies consisting of 447,656,503 people shows a slight negative correlation between the proportion of Cubans and household income with householder between the ages 25 and 44 in the United States with a correlation coefficient (R) of -0.054 and weighted average of $81,483, a difference of 2.6%.
Householder Income Ages 25 - 44 years Correlation Summary
| Measurement | Marshallese | Cuban |
| Minimum | $48,906 | $27,125 |
| Maximum | $109,583 | $133,668 |
| Range | $60,677 | $106,543 |
| Mean | $78,342 | $78,016 |
| Median | $75,712 | $78,321 |
| Interquartile 25% (IQ1) | $67,813 | $67,806 |
| Interquartile 75% (IQ3) | $91,124 | $86,783 |
| Interquartile Range (IQR) | $23,311 | $18,977 |
| Standard Deviation (Sample) | $18,418 | $17,466 |
| Standard Deviation (Population) | $17,794 | $17,384 |
Demographics Similar to Marshallese and Cubans by Householder Income Ages 25 - 44 years
In terms of householder income ages 25 - 44 years, the demographic groups most similar to Marshallese are Immigrants from Jamaica ($83,298, a difference of 0.33%), Immigrants from Belize ($83,141, a difference of 0.52%), Paiute ($82,984, a difference of 0.71%), Senegalese ($82,852, a difference of 0.87%), and Pima ($82,821, a difference of 0.91%). Similarly, the demographic groups most similar to Cubans are Blackfeet ($81,531, a difference of 0.060%), Yaqui ($81,656, a difference of 0.21%), Potawatomi ($81,774, a difference of 0.36%), Liberian ($82,005, a difference of 0.64%), and Shoshone ($82,062, a difference of 0.71%).
| Demographics | Rating | Rank | Householder Income Ages 25 - 44 years |
| Marshallese | 0.2 /100 | #274 | Tragic $83,575 |
| Immigrants | Jamaica | 0.2 /100 | #275 | Tragic $83,298 |
| Immigrants | Belize | 0.2 /100 | #276 | Tragic $83,141 |
| Paiute | 0.2 /100 | #277 | Tragic $82,984 |
| Senegalese | 0.2 /100 | #278 | Tragic $82,852 |
| Pima | 0.1 /100 | #279 | Tragic $82,821 |
| Colville | 0.1 /100 | #280 | Tragic $82,604 |
| Cajuns | 0.1 /100 | #281 | Tragic $82,393 |
| Central American Indians | 0.1 /100 | #282 | Tragic $82,355 |
| Guatemalans | 0.1 /100 | #283 | Tragic $82,331 |
| Immigrants | Middle Africa | 0.1 /100 | #284 | Tragic $82,254 |
| Immigrants | Somalia | 0.1 /100 | #285 | Tragic $82,188 |
| Ute | 0.1 /100 | #286 | Tragic $82,166 |
| Immigrants | Latin America | 0.1 /100 | #287 | Tragic $82,166 |
| Comanche | 0.1 /100 | #288 | Tragic $82,152 |
| Shoshone | 0.1 /100 | #289 | Tragic $82,062 |
| Liberians | 0.1 /100 | #290 | Tragic $82,005 |
| Potawatomi | 0.1 /100 | #291 | Tragic $81,774 |
| Yaqui | 0.1 /100 | #292 | Tragic $81,656 |
| Blackfeet | 0.1 /100 | #293 | Tragic $81,531 |
| Cubans | 0.1 /100 | #294 | Tragic $81,483 |