Alaskan Athabascan vs Immigrants from Southern Europe Householder Income Ages 25 - 44 years

COMPARE

Alaskan Athabascan
Race
Ancestry
AfghanAfricanAlaska NativeAlaskan AthabascanAlbanianAleutAlsatianAmericanApacheArabArapahoArgentineanArmenianAssyrian/Chaldean/SyriacAustralianAustrianBahamianBangladeshiBarbadianBasqueBelgianBelizeanBermudanBhutaneseBlackfeetBolivianBrazilianBritishBritish West IndianBulgarianBurmeseCajunCambodianCanadianCape VerdeanCarpatho RusynCelticCentral AmericanCentral American IndianCherokeeCheyenneChickasawChileanChineseChippewaChoctawColombianColvilleComancheCosta RicanCreeCreekCroatianCrowCubanCypriotCzechCzechoslovakianDanishDelawareDominicanDutchDutch West IndianEastern EuropeanEcuadorianEgyptianEnglishEstonianEthiopianEuropeanFijianFilipinoFinnishFrenchFrench American IndianFrench CanadianGermanGerman RussianGhanaianGreekGuamanian/ChamorroGuatemalanGuyaneseHaitianHmongHonduranHopiHoumaHungarianIcelanderIndian (Asian)IndonesianInupiatIranianIraqiIrishIroquoisIsraeliItalianJamaicanJapaneseJordanianKenyanKiowaKoreanLaotianLatvianLebaneseLiberianLithuanianLumbeeLuxembourgerMacedonianMalaysianMalteseMarshalleseMenomineeMexicanMexican American IndianMongolianMoroccanNative HawaiianNavajoNepaleseNew ZealanderNicaraguanNigerianNorthern EuropeanNorwegianOkinawanOsageOttawaPaiutePakistaniPalestinianPanamanianParaguayanPennsylvania GermanPeruvianPimaPolishPortuguesePotawatomiPuebloPuerto RicanPuget Sound SalishRomanianRussianSalvadoranSamoanScandinavianScotch-IrishScottishSeminoleSenegaleseSerbianShoshoneSierra LeoneanSiouxSlavicSlovakSloveneSomaliSouth AfricanSouth AmericanSouth American IndianSoviet UnionSpaniardSpanishSpanish AmericanSpanish American IndianSri LankanSubsaharan AfricanSudaneseSwedishSwissSyrianTaiwaneseThaiTlingit-HaidaTohono O'OdhamTonganTrinidadian and TobagonianTsimshianTurkishU.S. Virgin IslanderUgandanUkrainianUruguayanUteVenezuelanVietnameseWelshWest IndianYakamaYaquiYugoslavianYumanYup'ikZimbabwean
Immigration
NonimmigrantsImmigrantsAfghanistanAfricaAlbaniaArgentinaArmeniaAsiaAustraliaAustriaBahamasBangladeshBarbadosBelarusBelgiumBelizeBoliviaBosnia and HerzegovinaBrazilBulgariaBurma/MyanmarCabo VerdeCambodiaCameroonCanadaCaribbeanCentral AmericaChileChinaColombiaCongoCosta RicaCroatiaCubaCzechoslovakiaDenmarkDominicaDominican RepublicEastern AfricaEastern AsiaEastern EuropeEcuadorEgyptEl SalvadorEnglandEritreaEthiopiaEuropeFijiFranceGermanyGhanaGreeceGrenadaGuatemalaGuyanaHaitiHondurasHong KongHungaryIndiaIndonesiaIranIraqIrelandIsraelItalyJamaicaJapanJordanKazakhstanKenyaKoreaKuwaitLaosLatin AmericaLatviaLebanonLiberiaLithuaniaMalaysiaMexicoMicronesiaMiddle AfricaMoldovaMoroccoNepalNetherlandsNicaraguaNigeriaNorth AmericaNorth MacedoniaNorthern AfricaNorthern EuropeNorwayOceaniaPakistanPanamaPeruPhilippinesPolandPortugalRomaniaRussiaSaudi ArabiaScotlandSenegalSerbiaSierra LeoneSingaporeSomaliaSouth AfricaSouth AmericaSouth Central AsiaSouth Eastern AsiaSpainSri LankaSt. Vincent and the GrenadinesSudanSwedenSwitzerlandSyriaTaiwanThailandTrinidad and TobagoTurkeyUgandaUkraineUruguayUzbekistanVenezuelaVietnamWest IndiesWestern AfricaWestern AsiaWestern EuropeYemenZaireZimbabweAzores
Immigrants from Southern Europe
Race
Ancestry
AfghanAfricanAlaska NativeAlbanianAleutAlsatianAmericanApacheArabArapahoArgentineanArmenianAssyrian/Chaldean/SyriacAustralianAustrianBahamianBangladeshiBarbadianBasqueBelgianBelizeanBermudanBhutaneseBlackfeetBolivianBrazilianBritishBritish West IndianBulgarianBurmeseCajunCambodianCanadianCape VerdeanCarpatho RusynCelticCentral AmericanCentral American IndianCherokeeCheyenneChickasawChileanChineseChippewaChoctawColombianColvilleComancheCosta RicanCreeCreekCroatianCrowCubanCypriotCzechCzechoslovakianDanishDelawareDominicanDutchDutch West IndianEastern EuropeanEcuadorianEgyptianEnglishEstonianEthiopianEuropeanFijianFilipinoFinnishFrenchFrench American IndianFrench CanadianGermanGerman RussianGhanaianGreekGuamanian/ChamorroGuatemalanGuyaneseHaitianHmongHonduranHopiHoumaHungarianIcelanderIndian (Asian)IndonesianInupiatIranianIraqiIrishIroquoisIsraeliItalianJamaicanJapaneseJordanianKenyanKiowaKoreanLaotianLatvianLebaneseLiberianLithuanianLumbeeLuxembourgerMacedonianMalaysianMalteseMarshalleseMenomineeMexicanMexican American IndianMongolianMoroccanNative HawaiianNavajoNepaleseNew ZealanderNicaraguanNigerianNorthern EuropeanNorwegianOkinawanOsageOttawaPaiutePakistaniPalestinianPanamanianParaguayanPennsylvania GermanPeruvianPimaPolishPortuguesePotawatomiPuebloPuerto RicanPuget Sound SalishRomanianRussianSalvadoranSamoanScandinavianScotch-IrishScottishSeminoleSenegaleseSerbianShoshoneSierra LeoneanSiouxSlavicSlovakSloveneSomaliSouth AfricanSouth AmericanSouth American IndianSoviet UnionSpaniardSpanishSpanish AmericanSpanish American IndianSri LankanSubsaharan AfricanSudaneseSwedishSwissSyrianTaiwaneseThaiTlingit-HaidaTohono O'OdhamTonganTrinidadian and TobagonianTsimshianTurkishU.S. Virgin IslanderUgandanUkrainianUruguayanUteVenezuelanVietnameseWelshWest IndianYakamaYaquiYugoslavianYumanYup'ikZimbabwean
Immigration
NonimmigrantsImmigrantsAfghanistanAfricaAlbaniaArgentinaArmeniaAsiaAustraliaAustriaBahamasBangladeshBarbadosBelarusBelgiumBelizeBoliviaBosnia and HerzegovinaBrazilBulgariaBurma/MyanmarCabo VerdeCambodiaCameroonCanadaCaribbeanCentral AmericaChileChinaColombiaCongoCosta RicaCroatiaCubaCzechoslovakiaDenmarkDominicaDominican RepublicEastern AfricaEastern AsiaEastern EuropeEcuadorEgyptEl SalvadorEnglandEritreaEthiopiaEuropeFijiFranceGermanyGhanaGreeceGrenadaGuatemalaGuyanaHaitiHondurasHong KongHungaryIndiaIndonesiaIranIraqIrelandIsraelItalyJamaicaJapanJordanKazakhstanKenyaKoreaKuwaitLaosLatin AmericaLatviaLebanonLiberiaLithuaniaMalaysiaMexicoMicronesiaMiddle AfricaMoldovaMoroccoNepalNetherlandsNicaraguaNigeriaNorth AmericaNorth MacedoniaNorthern AfricaNorthern EuropeNorwayOceaniaPakistanPanamaPeruPhilippinesPolandPortugalRomaniaRussiaSaudi ArabiaScotlandSenegalSerbiaSierra LeoneSingaporeSomaliaSouth AfricaSouth AmericaSouth Central AsiaSouth Eastern AsiaSouthern EuropeSpainSri LankaSt. Vincent and the GrenadinesSudanSwedenSwitzerlandSyriaTaiwanThailandTrinidad and TobagoTurkeyUgandaUkraineUruguayUzbekistanVenezuelaVietnamWest IndiesWestern AfricaWestern AsiaWestern EuropeYemenZaireZimbabweAzores
Householder Income Ages 25 - 44 years
Income
Poverty
Unemployment
Labor Participation
Family Structure
Vehicle Availability
Education Level
Disability

Householder Income Ages 25 - 44 years Comparison

Alaskan Athabascans

Immigrants from Southern Europe

Tragic
Exceptional
$88,446
HOUSEHOLDER INCOME AGES 25 - 44 YEARS
3.3/ 100
METRIC RATING
230th/ 347
METRIC RANK
$103,486
HOUSEHOLDER INCOME AGES 25 - 44 YEARS
99.3/ 100
METRIC RATING
77th/ 347
METRIC RANK

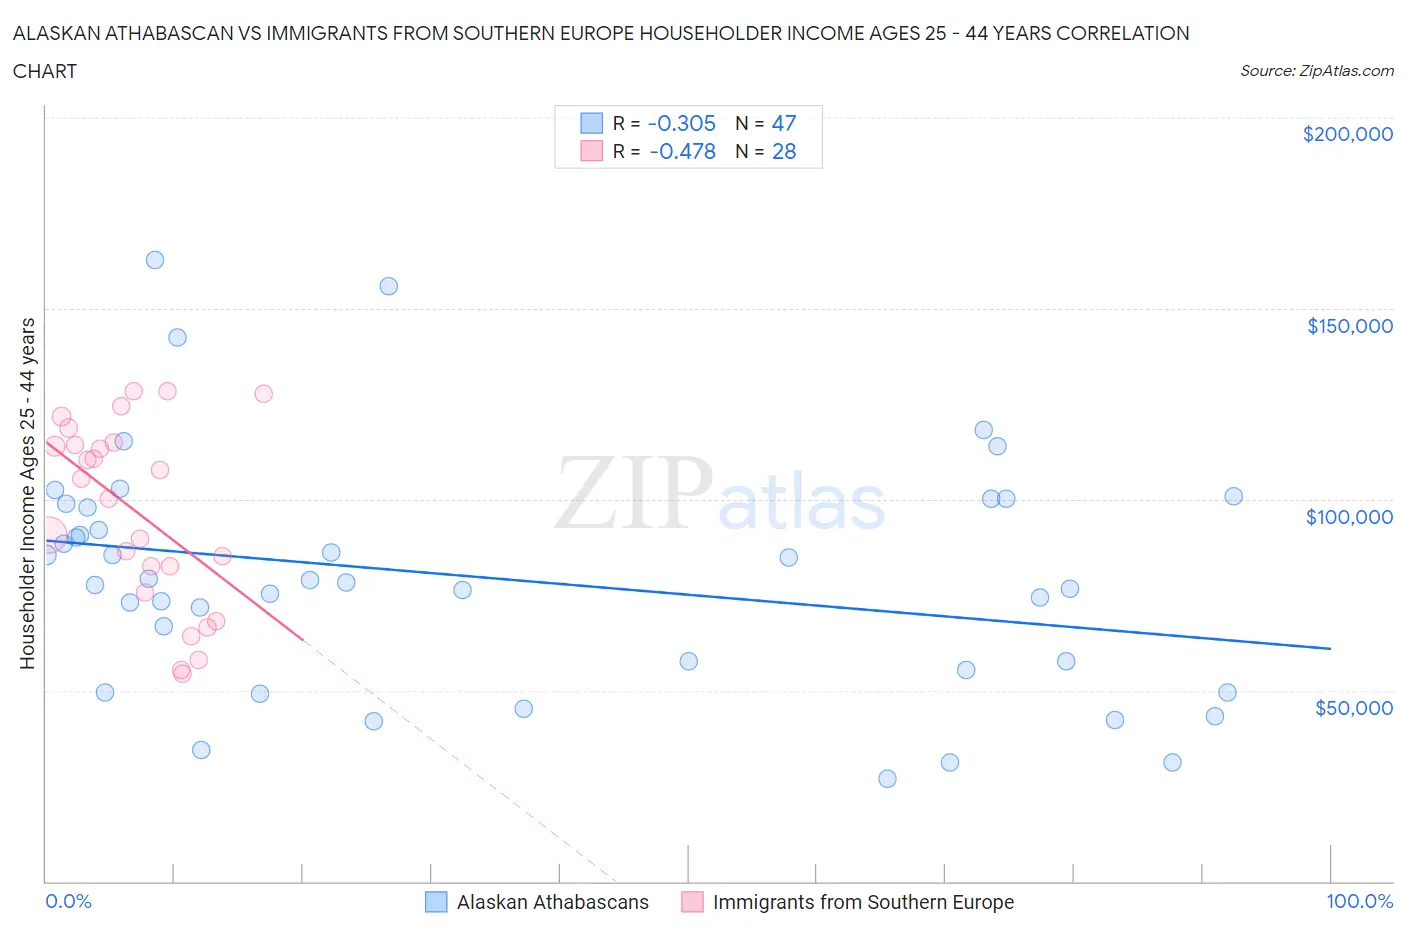
Alaskan Athabascan vs Immigrants from Southern Europe Householder Income Ages 25 - 44 years Correlation Chart

The statistical analysis conducted on geographies consisting of 45,791,396 people shows a mild negative correlation between the proportion of Alaskan Athabascans and household income with householder between the ages 25 and 44 in the United States with a correlation coefficient (R) of -0.305 and weighted average of $88,446. Similarly, the statistical analysis conducted on geographies consisting of 401,612,354 people shows a moderate negative correlation between the proportion of Immigrants from Southern Europe and household income with householder between the ages 25 and 44 in the United States with a correlation coefficient (R) of -0.478 and weighted average of $103,486, a difference of 17.0%.
Alaskan Athabascan vs Immigrants from Southern Europe Householder Income Ages 25 - 44 years

Householder Income Ages 25 - 44 years Correlation Summary

MeasurementAlaskan AthabascanImmigrants from Southern Europe
Minimum$26,875$54,315
Maximum$162,636$128,289
Range$135,761$73,974
Mean$79,344$96,371
Median$78,125$102,776
Interquartile 25% (IQ1)$55,208$78,949
Interquartile 75% (IQ3)$98,910$114,674
Interquartile Range (IQR)$43,702$35,724
Standard Deviation (Sample)$30,855$24,047
Standard Deviation (Population)$30,525$23,614

Similar Demographics by Householder Income Ages 25 - 44 years

Demographics Similar to Alaskan Athabascans by Householder Income Ages 25 - 44 years

In terms of householder income ages 25 - 44 years, the demographic groups most similar to Alaskan Athabascans are Immigrants from Grenada ($88,311, a difference of 0.15%), Nonimmigrants ($88,301, a difference of 0.16%), Malaysian ($88,291, a difference of 0.18%), Venezuelan ($88,232, a difference of 0.24%), and Bermudan ($88,231, a difference of 0.24%).
DemographicsRating | RankHouseholder Income Ages 25 - 44 years
Immigrants | Guyana
5.9
/100
|
#223
Tragic
$89,586
Barbadians
5.9
/100
|
#224
Tragic
$89,565
Immigrants | Panama
5.5
/100
|
#225
Tragic
$89,451
Immigrants | Iraq
5.5
/100
|
#226
Tragic
$89,444
Immigrants | St. Vincent and the Grenadines
4.1
/100
|
#227
Tragic
$88,888
Immigrants | Bosnia and Herzegovina
4.0
/100
|
#228
Tragic
$88,819
Immigrants | Barbados
3.7
/100
|
#229
Tragic
$88,687
Alaskan Athabascans
3.3
/100
|
#230
Tragic
$88,446
Immigrants | Grenada
3.0
/100
|
#231
Tragic
$88,311
Immigrants | Nonimmigrants
3.0
/100
|
#232
Tragic
$88,301
Malaysians
3.0
/100
|
#233
Tragic
$88,291
Venezuelans
2.9
/100
|
#234
Tragic
$88,232
Bermudans
2.9
/100
|
#235
Tragic
$88,231
Immigrants | Cameroon
2.9
/100
|
#236
Tragic
$88,214
Salvadorans
2.8
/100
|
#237
Tragic
$88,198

Demographics Similar to Immigrants from Southern Europe by Householder Income Ages 25 - 44 years

In terms of householder income ages 25 - 44 years, the demographic groups most similar to Immigrants from Southern Europe are Immigrants from Bulgaria ($103,423, a difference of 0.060%), Armenian ($103,248, a difference of 0.23%), Immigrants from Spain ($103,752, a difference of 0.26%), Immigrants from Egypt ($103,192, a difference of 0.28%), and South African ($103,160, a difference of 0.32%).
DemographicsRating | RankHouseholder Income Ages 25 - 44 years
Immigrants | Croatia
99.6
/100
|
#70
Exceptional
$104,503
Afghans
99.6
/100
|
#71
Exceptional
$104,410
Chinese
99.5
/100
|
#72
Exceptional
$104,264
Italians
99.5
/100
|
#73
Exceptional
$104,215
Immigrants | Fiji
99.5
/100
|
#74
Exceptional
$103,954
Koreans
99.4
/100
|
#75
Exceptional
$103,824
Immigrants | Spain
99.4
/100
|
#76
Exceptional
$103,752
Immigrants | Southern Europe
99.3
/100
|
#77
Exceptional
$103,486
Immigrants | Bulgaria
99.3
/100
|
#78
Exceptional
$103,423
Armenians
99.2
/100
|
#79
Exceptional
$103,248
Immigrants | Egypt
99.2
/100
|
#80
Exceptional
$103,192
South Africans
99.2
/100
|
#81
Exceptional
$103,160
Immigrants | Serbia
99.2
/100
|
#82
Exceptional
$103,155
Argentineans
99.1
/100
|
#83
Exceptional
$103,111
Immigrants | Philippines
99.0
/100
|
#84
Exceptional
$102,910