Kiowa vs Cuban Householder Income Ages 25 - 44 years
COMPARE
Kiowa
Cuban
Householder Income Ages 25 - 44 years
Householder Income Ages 25 - 44 years Comparison
Kiowa
Cubans
$74,776
HOUSEHOLDER INCOME AGES 25 - 44 YEARS
0.0/ 100
METRIC RATING
335th/ 347
METRIC RANK
$81,483
HOUSEHOLDER INCOME AGES 25 - 44 YEARS
0.1/ 100
METRIC RATING
294th/ 347
METRIC RANK
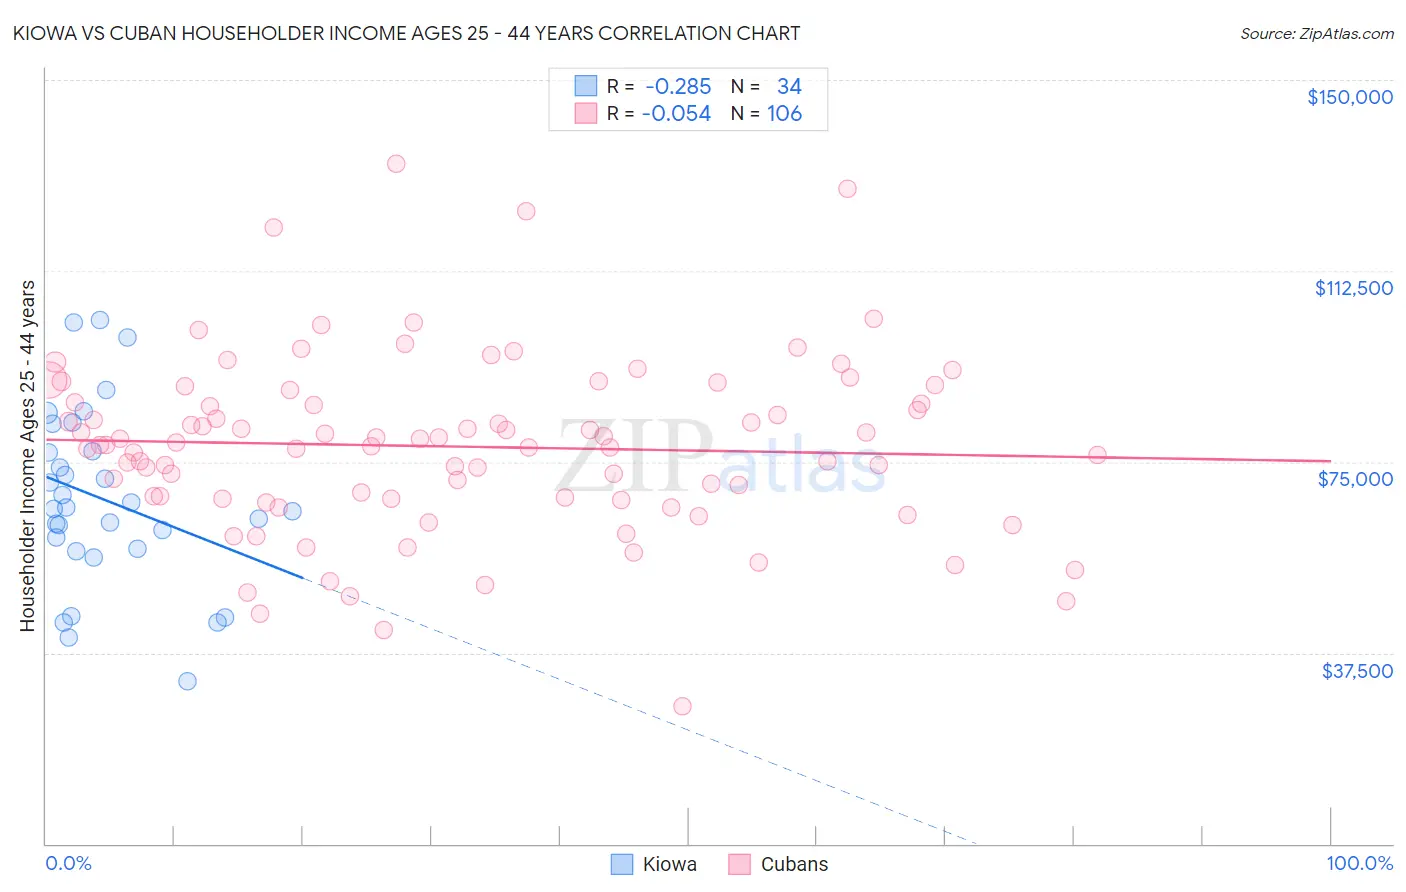
Kiowa vs Cuban Householder Income Ages 25 - 44 years Correlation Chart
The statistical analysis conducted on geographies consisting of 56,084,974 people shows a weak negative correlation between the proportion of Kiowa and household income with householder between the ages 25 and 44 in the United States with a correlation coefficient (R) of -0.285 and weighted average of $74,776. Similarly, the statistical analysis conducted on geographies consisting of 447,656,503 people shows a slight negative correlation between the proportion of Cubans and household income with householder between the ages 25 and 44 in the United States with a correlation coefficient (R) of -0.054 and weighted average of $81,483, a difference of 9.0%.
Householder Income Ages 25 - 44 years Correlation Summary
| Measurement | Kiowa | Cuban |
| Minimum | $31,875 | $27,125 |
| Maximum | $102,750 | $133,668 |
| Range | $70,875 | $106,543 |
| Mean | $67,591 | $78,016 |
| Median | $65,895 | $78,321 |
| Interquartile 25% (IQ1) | $57,875 | $67,806 |
| Interquartile 75% (IQ3) | $77,000 | $86,783 |
| Interquartile Range (IQR) | $19,125 | $18,977 |
| Standard Deviation (Sample) | $17,380 | $17,466 |
| Standard Deviation (Population) | $17,122 | $17,384 |
Similar Demographics by Householder Income Ages 25 - 44 years
Demographics Similar to Kiowa by Householder Income Ages 25 - 44 years
In terms of householder income ages 25 - 44 years, the demographic groups most similar to Kiowa are Creek ($74,847, a difference of 0.10%), Hopi ($75,002, a difference of 0.30%), Bahamian ($75,395, a difference of 0.83%), Native/Alaskan ($75,647, a difference of 1.2%), and Yup'ik ($73,688, a difference of 1.5%).
| Demographics | Rating | Rank | Householder Income Ages 25 - 44 years |
| Immigrants | Cuba | 0.0 /100 | #328 | Tragic $76,701 |
| Seminole | 0.0 /100 | #329 | Tragic $76,584 |
| Yakama | 0.0 /100 | #330 | Tragic $76,226 |
| Natives/Alaskans | 0.0 /100 | #331 | Tragic $75,647 |
| Bahamians | 0.0 /100 | #332 | Tragic $75,395 |
| Hopi | 0.0 /100 | #333 | Tragic $75,002 |
| Creek | 0.0 /100 | #334 | Tragic $74,847 |
| Kiowa | 0.0 /100 | #335 | Tragic $74,776 |
| Yup'ik | 0.0 /100 | #336 | Tragic $73,688 |
| Blacks/African Americans | 0.0 /100 | #337 | Tragic $73,370 |
| Immigrants | Yemen | 0.0 /100 | #338 | Tragic $73,043 |
| Yuman | 0.0 /100 | #339 | Tragic $72,956 |
| Immigrants | Congo | 0.0 /100 | #340 | Tragic $72,178 |
| Arapaho | 0.0 /100 | #341 | Tragic $71,697 |
| Crow | 0.0 /100 | #342 | Tragic $71,337 |
Demographics Similar to Cubans by Householder Income Ages 25 - 44 years
In terms of householder income ages 25 - 44 years, the demographic groups most similar to Cubans are Blackfeet ($81,531, a difference of 0.060%), Bangladeshi ($81,363, a difference of 0.15%), Immigrants from Dominica ($81,351, a difference of 0.16%), Immigrants from Guatemala ($81,341, a difference of 0.17%), and Yaqui ($81,656, a difference of 0.21%).
| Demographics | Rating | Rank | Householder Income Ages 25 - 44 years |
| Immigrants | Latin America | 0.1 /100 | #287 | Tragic $82,166 |
| Comanche | 0.1 /100 | #288 | Tragic $82,152 |
| Shoshone | 0.1 /100 | #289 | Tragic $82,062 |
| Liberians | 0.1 /100 | #290 | Tragic $82,005 |
| Potawatomi | 0.1 /100 | #291 | Tragic $81,774 |
| Yaqui | 0.1 /100 | #292 | Tragic $81,656 |
| Blackfeet | 0.1 /100 | #293 | Tragic $81,531 |
| Cubans | 0.1 /100 | #294 | Tragic $81,483 |
| Bangladeshis | 0.1 /100 | #295 | Tragic $81,363 |
| Immigrants | Dominica | 0.1 /100 | #296 | Tragic $81,351 |
| Immigrants | Guatemala | 0.1 /100 | #297 | Tragic $81,341 |
| Dominicans | 0.1 /100 | #298 | Tragic $81,229 |
| Immigrants | Liberia | 0.1 /100 | #299 | Tragic $80,863 |
| Cherokee | 0.0 /100 | #300 | Tragic $80,843 |
| Immigrants | Micronesia | 0.0 /100 | #301 | Tragic $80,544 |