Alaskan Athabascan vs Cuban Family Poverty
COMPARE
Alaskan Athabascan
Cuban
Family Poverty
Family Poverty Comparison
Alaskan Athabascans
Cubans
10.1%
FAMILY POVERTY
2.7/ 100
METRIC RATING
231st/ 347
METRIC RANK
10.6%
FAMILY POVERTY
0.4/ 100
METRIC RATING
249th/ 347
METRIC RANK
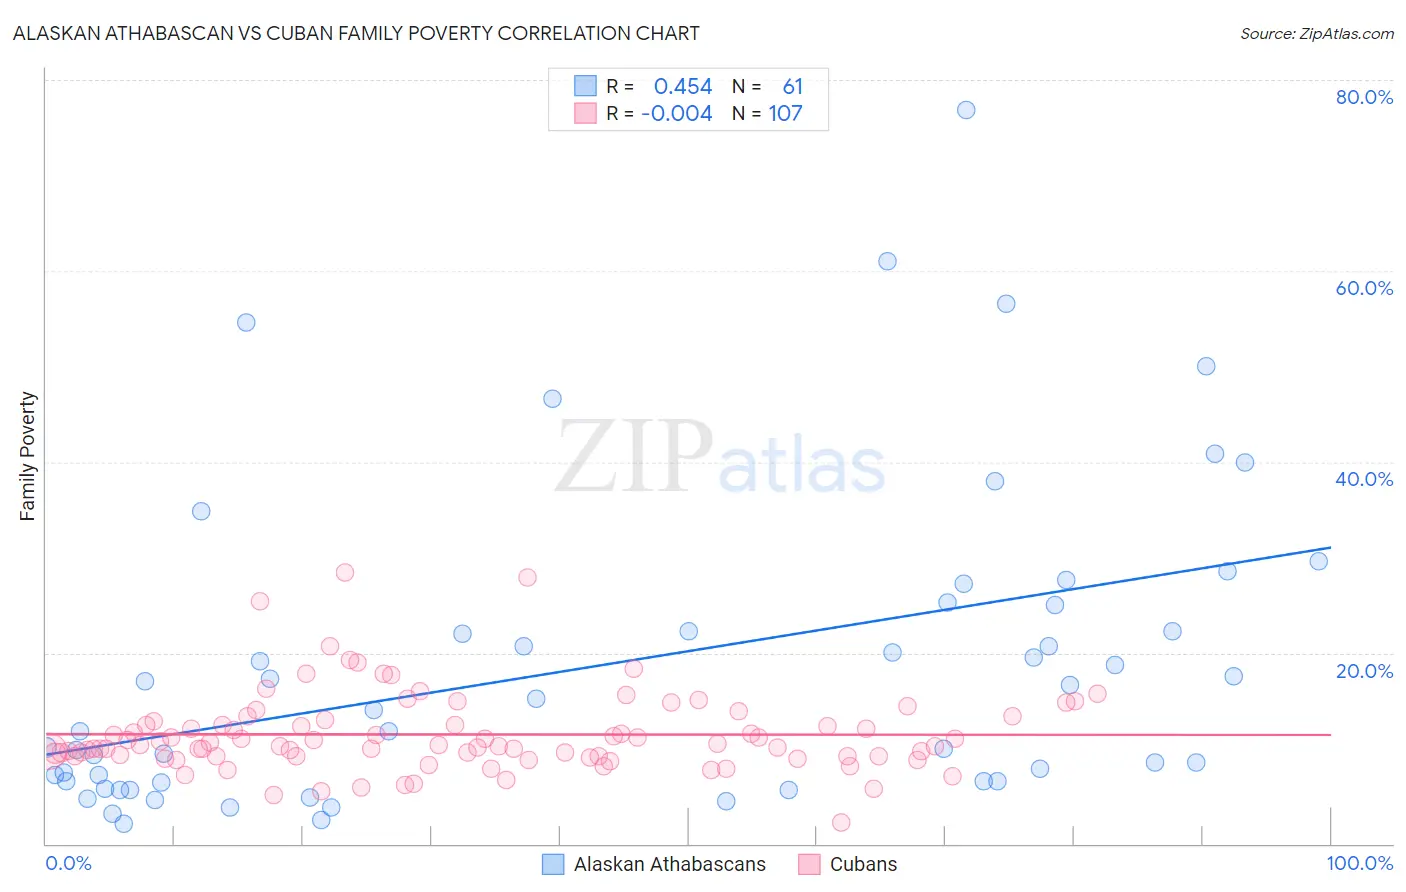
Alaskan Athabascan vs Cuban Family Poverty Correlation Chart
The statistical analysis conducted on geographies consisting of 45,790,128 people shows a moderate positive correlation between the proportion of Alaskan Athabascans and poverty level among families in the United States with a correlation coefficient (R) of 0.454 and weighted average of 10.1%. Similarly, the statistical analysis conducted on geographies consisting of 447,916,186 people shows no correlation between the proportion of Cubans and poverty level among families in the United States with a correlation coefficient (R) of -0.004 and weighted average of 10.6%, a difference of 5.7%.
Family Poverty Correlation Summary
| Measurement | Alaskan Athabascan | Cuban |
| Minimum | 2.0% | 2.2% |
| Maximum | 76.9% | 28.4% |
| Range | 74.9% | 26.2% |
| Mean | 18.8% | 11.4% |
| Median | 14.0% | 10.3% |
| Interquartile 25% (IQ1) | 6.5% | 9.1% |
| Interquartile 75% (IQ3) | 25.1% | 12.9% |
| Interquartile Range (IQR) | 18.6% | 3.8% |
| Standard Deviation (Sample) | 16.5% | 4.2% |
| Standard Deviation (Population) | 16.3% | 4.2% |
Demographics Similar to Alaskan Athabascans and Cubans by Family Poverty
In terms of family poverty, the demographic groups most similar to Alaskan Athabascans are Immigrants from Panama (10.0%, a difference of 0.38%), Immigrants from Sudan (10.1%, a difference of 0.43%), Fijian (10.1%, a difference of 0.69%), Immigrants from Middle Africa (10.1%, a difference of 0.79%), and Nigerian (10.1%, a difference of 0.83%). Similarly, the demographic groups most similar to Cubans are Nicaraguan (10.6%, a difference of 0.050%), Liberian (10.6%, a difference of 0.25%), Cherokee (10.6%, a difference of 0.34%), Salvadoran (10.7%, a difference of 0.53%), and Immigrants from Burma/Myanmar (10.5%, a difference of 0.98%).
| Demographics | Rating | Rank | Family Poverty |
| Immigrants | Panama | 3.1 /100 | #230 | Tragic 10.0% |
| Alaskan Athabascans | 2.7 /100 | #231 | Tragic 10.1% |
| Immigrants | Sudan | 2.3 /100 | #232 | Tragic 10.1% |
| Fijians | 2.1 /100 | #233 | Tragic 10.1% |
| Immigrants | Middle Africa | 2.1 /100 | #234 | Tragic 10.1% |
| Nigerians | 2.0 /100 | #235 | Tragic 10.1% |
| Immigrants | Nigeria | 1.9 /100 | #236 | Tragic 10.2% |
| Immigrants | Laos | 1.7 /100 | #237 | Tragic 10.2% |
| French American Indians | 1.5 /100 | #238 | Tragic 10.2% |
| Potawatomi | 1.5 /100 | #239 | Tragic 10.2% |
| Immigrants | Azores | 1.4 /100 | #240 | Tragic 10.3% |
| Ghanaians | 1.3 /100 | #241 | Tragic 10.3% |
| Alaska Natives | 1.0 /100 | #242 | Tragic 10.4% |
| Nepalese | 0.8 /100 | #243 | Tragic 10.4% |
| Cree | 0.7 /100 | #244 | Tragic 10.5% |
| Immigrants | Burma/Myanmar | 0.6 /100 | #245 | Tragic 10.5% |
| Cherokee | 0.5 /100 | #246 | Tragic 10.6% |
| Liberians | 0.4 /100 | #247 | Tragic 10.6% |
| Nicaraguans | 0.4 /100 | #248 | Tragic 10.6% |
| Cubans | 0.4 /100 | #249 | Tragic 10.6% |
| Salvadorans | 0.3 /100 | #250 | Tragic 10.7% |