Alaskan Athabascan vs Immigrants from Western Europe Householder Income Ages 25 - 44 years
COMPARE
Alaskan Athabascan
Immigrants from Western Europe
Householder Income Ages 25 - 44 years
Householder Income Ages 25 - 44 years Comparison
Alaskan Athabascans
Immigrants from Western Europe
$88,446
HOUSEHOLDER INCOME AGES 25 - 44 YEARS
3.3/ 100
METRIC RATING
230th/ 347
METRIC RANK
$102,654
HOUSEHOLDER INCOME AGES 25 - 44 YEARS
98.9/ 100
METRIC RATING
87th/ 347
METRIC RANK
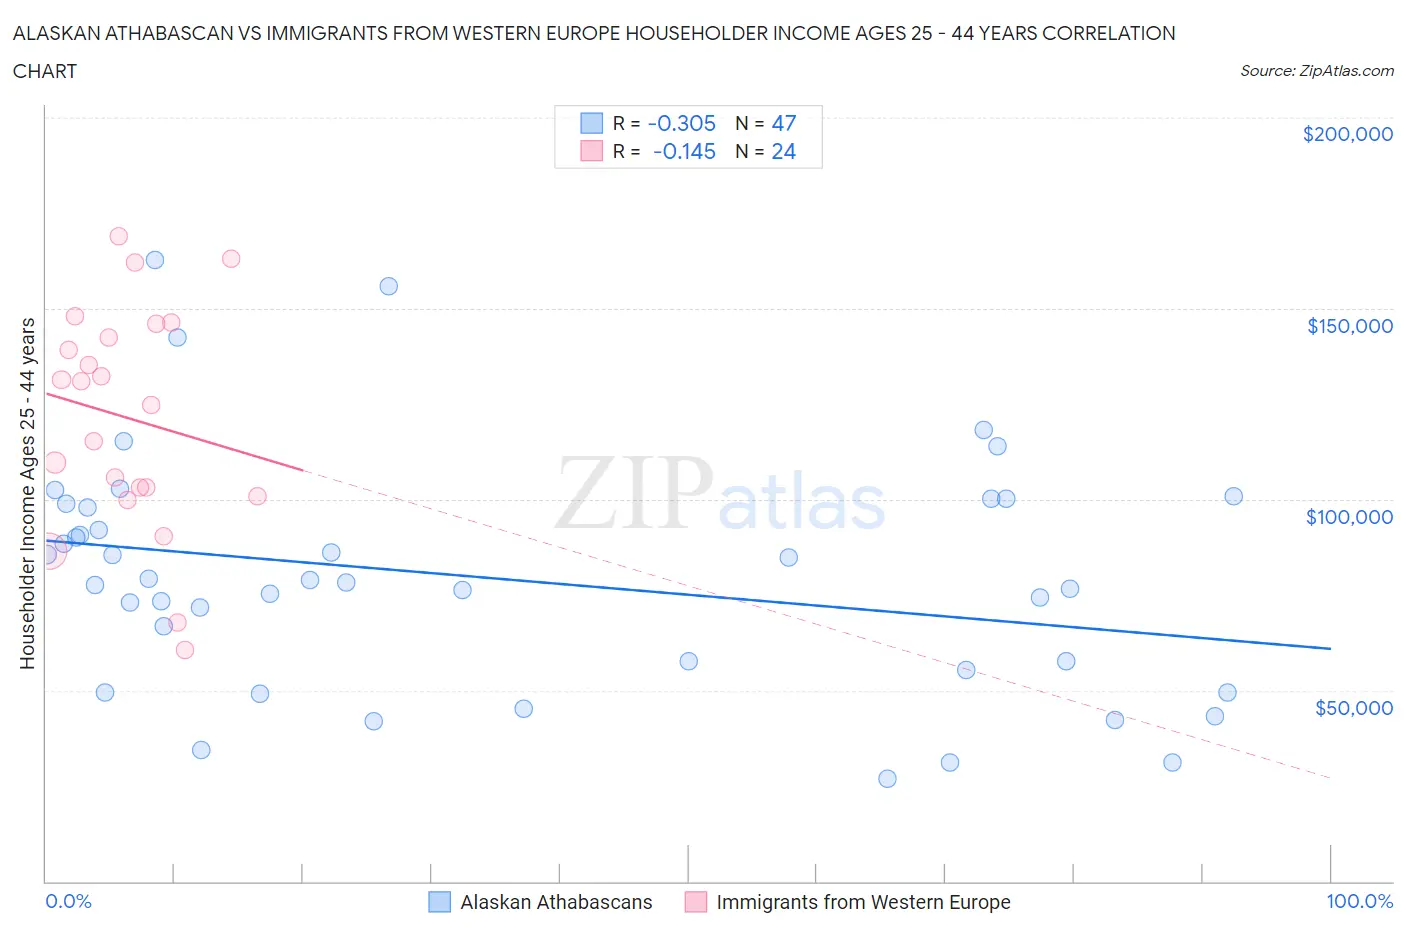
Alaskan Athabascan vs Immigrants from Western Europe Householder Income Ages 25 - 44 years Correlation Chart
The statistical analysis conducted on geographies consisting of 45,791,396 people shows a mild negative correlation between the proportion of Alaskan Athabascans and household income with householder between the ages 25 and 44 in the United States with a correlation coefficient (R) of -0.305 and weighted average of $88,446. Similarly, the statistical analysis conducted on geographies consisting of 491,977,269 people shows a poor negative correlation between the proportion of Immigrants from Western Europe and household income with householder between the ages 25 and 44 in the United States with a correlation coefficient (R) of -0.145 and weighted average of $102,654, a difference of 16.1%.
Householder Income Ages 25 - 44 years Correlation Summary
| Measurement | Alaskan Athabascan | Immigrants from Western Europe |
| Minimum | $26,875 | $60,664 |
| Maximum | $162,636 | $169,009 |
| Range | $135,761 | $108,344 |
| Mean | $79,344 | $121,344 |
| Median | $78,125 | $127,790 |
| Interquartile 25% (IQ1) | $55,208 | $101,950 |
| Interquartile 75% (IQ3) | $98,910 | $144,131 |
| Interquartile Range (IQR) | $43,702 | $42,181 |
| Standard Deviation (Sample) | $30,855 | $29,174 |
| Standard Deviation (Population) | $30,525 | $28,560 |
Similar Demographics by Householder Income Ages 25 - 44 years
Demographics Similar to Alaskan Athabascans by Householder Income Ages 25 - 44 years
In terms of householder income ages 25 - 44 years, the demographic groups most similar to Alaskan Athabascans are Immigrants from Grenada ($88,311, a difference of 0.15%), Nonimmigrants ($88,301, a difference of 0.16%), Malaysian ($88,291, a difference of 0.18%), Venezuelan ($88,232, a difference of 0.24%), and Bermudan ($88,231, a difference of 0.24%).
| Demographics | Rating | Rank | Householder Income Ages 25 - 44 years |
| Immigrants | Guyana | 5.9 /100 | #223 | Tragic $89,586 |
| Barbadians | 5.9 /100 | #224 | Tragic $89,565 |
| Immigrants | Panama | 5.5 /100 | #225 | Tragic $89,451 |
| Immigrants | Iraq | 5.5 /100 | #226 | Tragic $89,444 |
| Immigrants | St. Vincent and the Grenadines | 4.1 /100 | #227 | Tragic $88,888 |
| Immigrants | Bosnia and Herzegovina | 4.0 /100 | #228 | Tragic $88,819 |
| Immigrants | Barbados | 3.7 /100 | #229 | Tragic $88,687 |
| Alaskan Athabascans | 3.3 /100 | #230 | Tragic $88,446 |
| Immigrants | Grenada | 3.0 /100 | #231 | Tragic $88,311 |
| Immigrants | Nonimmigrants | 3.0 /100 | #232 | Tragic $88,301 |
| Malaysians | 3.0 /100 | #233 | Tragic $88,291 |
| Venezuelans | 2.9 /100 | #234 | Tragic $88,232 |
| Bermudans | 2.9 /100 | #235 | Tragic $88,231 |
| Immigrants | Cameroon | 2.9 /100 | #236 | Tragic $88,214 |
| Salvadorans | 2.8 /100 | #237 | Tragic $88,198 |
Demographics Similar to Immigrants from Western Europe by Householder Income Ages 25 - 44 years
In terms of householder income ages 25 - 44 years, the demographic groups most similar to Immigrants from Western Europe are Immigrants from Hungary ($102,655, a difference of 0.0%), Immigrants from Ukraine ($102,664, a difference of 0.010%), Immigrants from Canada ($102,616, a difference of 0.040%), Romanian ($102,544, a difference of 0.11%), and Ukrainian ($102,451, a difference of 0.20%).
| Demographics | Rating | Rank | Householder Income Ages 25 - 44 years |
| Immigrants | Egypt | 99.2 /100 | #80 | Exceptional $103,192 |
| South Africans | 99.2 /100 | #81 | Exceptional $103,160 |
| Immigrants | Serbia | 99.2 /100 | #82 | Exceptional $103,155 |
| Argentineans | 99.1 /100 | #83 | Exceptional $103,111 |
| Immigrants | Philippines | 99.0 /100 | #84 | Exceptional $102,910 |
| Immigrants | Ukraine | 98.9 /100 | #85 | Exceptional $102,664 |
| Immigrants | Hungary | 98.9 /100 | #86 | Exceptional $102,655 |
| Immigrants | Western Europe | 98.9 /100 | #87 | Exceptional $102,654 |
| Immigrants | Canada | 98.9 /100 | #88 | Exceptional $102,616 |
| Romanians | 98.8 /100 | #89 | Exceptional $102,544 |
| Ukrainians | 98.8 /100 | #90 | Exceptional $102,451 |
| Croatians | 98.7 /100 | #91 | Exceptional $102,414 |
| Immigrants | North America | 98.7 /100 | #92 | Exceptional $102,407 |
| Immigrants | England | 98.4 /100 | #93 | Exceptional $102,020 |
| Sri Lankans | 98.4 /100 | #94 | Exceptional $101,960 |