Alaskan Athabascan vs Apache Householder Income Ages 25 - 44 years
COMPARE
Alaskan Athabascan
Apache
Householder Income Ages 25 - 44 years
Householder Income Ages 25 - 44 years Comparison
Alaskan Athabascans
Apache
$88,446
HOUSEHOLDER INCOME AGES 25 - 44 YEARS
3.3/ 100
METRIC RATING
230th/ 347
METRIC RANK
$80,260
HOUSEHOLDER INCOME AGES 25 - 44 YEARS
0.0/ 100
METRIC RATING
306th/ 347
METRIC RANK
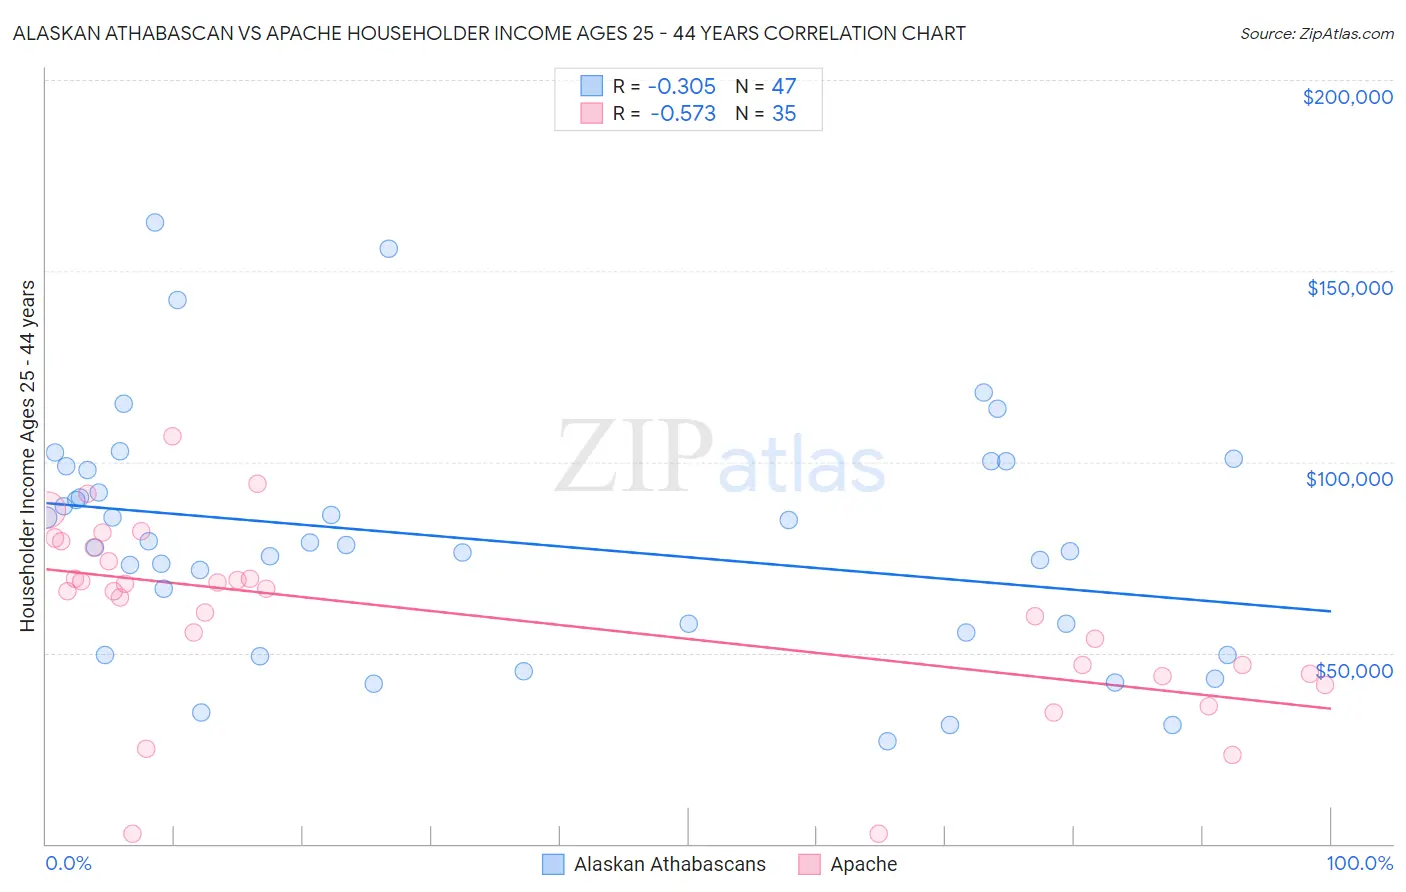
Alaskan Athabascan vs Apache Householder Income Ages 25 - 44 years Correlation Chart
The statistical analysis conducted on geographies consisting of 45,791,396 people shows a mild negative correlation between the proportion of Alaskan Athabascans and household income with householder between the ages 25 and 44 in the United States with a correlation coefficient (R) of -0.305 and weighted average of $88,446. Similarly, the statistical analysis conducted on geographies consisting of 230,671,179 people shows a substantial negative correlation between the proportion of Apache and household income with householder between the ages 25 and 44 in the United States with a correlation coefficient (R) of -0.573 and weighted average of $80,260, a difference of 10.2%.
Householder Income Ages 25 - 44 years Correlation Summary
| Measurement | Alaskan Athabascan | Apache |
| Minimum | $26,875 | $2,499 |
| Maximum | $162,636 | $106,561 |
| Range | $135,761 | $104,062 |
| Mean | $79,344 | $60,213 |
| Median | $78,125 | $66,174 |
| Interquartile 25% (IQ1) | $55,208 | $44,643 |
| Interquartile 75% (IQ3) | $98,910 | $77,529 |
| Interquartile Range (IQR) | $43,702 | $32,886 |
| Standard Deviation (Sample) | $30,855 | $24,023 |
| Standard Deviation (Population) | $30,525 | $23,677 |
Similar Demographics by Householder Income Ages 25 - 44 years
Demographics Similar to Alaskan Athabascans by Householder Income Ages 25 - 44 years
In terms of householder income ages 25 - 44 years, the demographic groups most similar to Alaskan Athabascans are Immigrants from Grenada ($88,311, a difference of 0.15%), Nonimmigrants ($88,301, a difference of 0.16%), Malaysian ($88,291, a difference of 0.18%), Venezuelan ($88,232, a difference of 0.24%), and Bermudan ($88,231, a difference of 0.24%).
| Demographics | Rating | Rank | Householder Income Ages 25 - 44 years |
| Immigrants | Guyana | 5.9 /100 | #223 | Tragic $89,586 |
| Barbadians | 5.9 /100 | #224 | Tragic $89,565 |
| Immigrants | Panama | 5.5 /100 | #225 | Tragic $89,451 |
| Immigrants | Iraq | 5.5 /100 | #226 | Tragic $89,444 |
| Immigrants | St. Vincent and the Grenadines | 4.1 /100 | #227 | Tragic $88,888 |
| Immigrants | Bosnia and Herzegovina | 4.0 /100 | #228 | Tragic $88,819 |
| Immigrants | Barbados | 3.7 /100 | #229 | Tragic $88,687 |
| Alaskan Athabascans | 3.3 /100 | #230 | Tragic $88,446 |
| Immigrants | Grenada | 3.0 /100 | #231 | Tragic $88,311 |
| Immigrants | Nonimmigrants | 3.0 /100 | #232 | Tragic $88,301 |
| Malaysians | 3.0 /100 | #233 | Tragic $88,291 |
| Venezuelans | 2.9 /100 | #234 | Tragic $88,232 |
| Bermudans | 2.9 /100 | #235 | Tragic $88,231 |
| Immigrants | Cameroon | 2.9 /100 | #236 | Tragic $88,214 |
| Salvadorans | 2.8 /100 | #237 | Tragic $88,198 |
Demographics Similar to Apache by Householder Income Ages 25 - 44 years
In terms of householder income ages 25 - 44 years, the demographic groups most similar to Apache are Immigrants from Dominican Republic ($80,319, a difference of 0.070%), Immigrants from Caribbean ($80,326, a difference of 0.080%), Mexican ($80,427, a difference of 0.21%), Haitian ($80,055, a difference of 0.26%), and Immigrants from Central America ($80,012, a difference of 0.31%).
| Demographics | Rating | Rank | Householder Income Ages 25 - 44 years |
| Immigrants | Liberia | 0.1 /100 | #299 | Tragic $80,863 |
| Cherokee | 0.0 /100 | #300 | Tragic $80,843 |
| Immigrants | Micronesia | 0.0 /100 | #301 | Tragic $80,544 |
| Hispanics or Latinos | 0.0 /100 | #302 | Tragic $80,515 |
| Mexicans | 0.0 /100 | #303 | Tragic $80,427 |
| Immigrants | Caribbean | 0.0 /100 | #304 | Tragic $80,326 |
| Immigrants | Dominican Republic | 0.0 /100 | #305 | Tragic $80,319 |
| Apache | 0.0 /100 | #306 | Tragic $80,260 |
| Haitians | 0.0 /100 | #307 | Tragic $80,055 |
| Immigrants | Central America | 0.0 /100 | #308 | Tragic $80,012 |
| Chippewa | 0.0 /100 | #309 | Tragic $80,005 |
| Fijians | 0.0 /100 | #310 | Tragic $79,956 |
| Indonesians | 0.0 /100 | #311 | Tragic $79,543 |
| Immigrants | Haiti | 0.0 /100 | #312 | Tragic $79,391 |
| Menominee | 0.0 /100 | #313 | Tragic $79,358 |