American vs German Russian Median Household Income
COMPARE
American
German Russian
Median Household Income
Median Household Income Comparison
Americans
German Russians
$75,932
MEDIAN HOUSEHOLD INCOME
0.3/ 100
METRIC RATING
266th/ 347
METRIC RANK
$75,856
MEDIAN HOUSEHOLD INCOME
0.3/ 100
METRIC RATING
267th/ 347
METRIC RANK
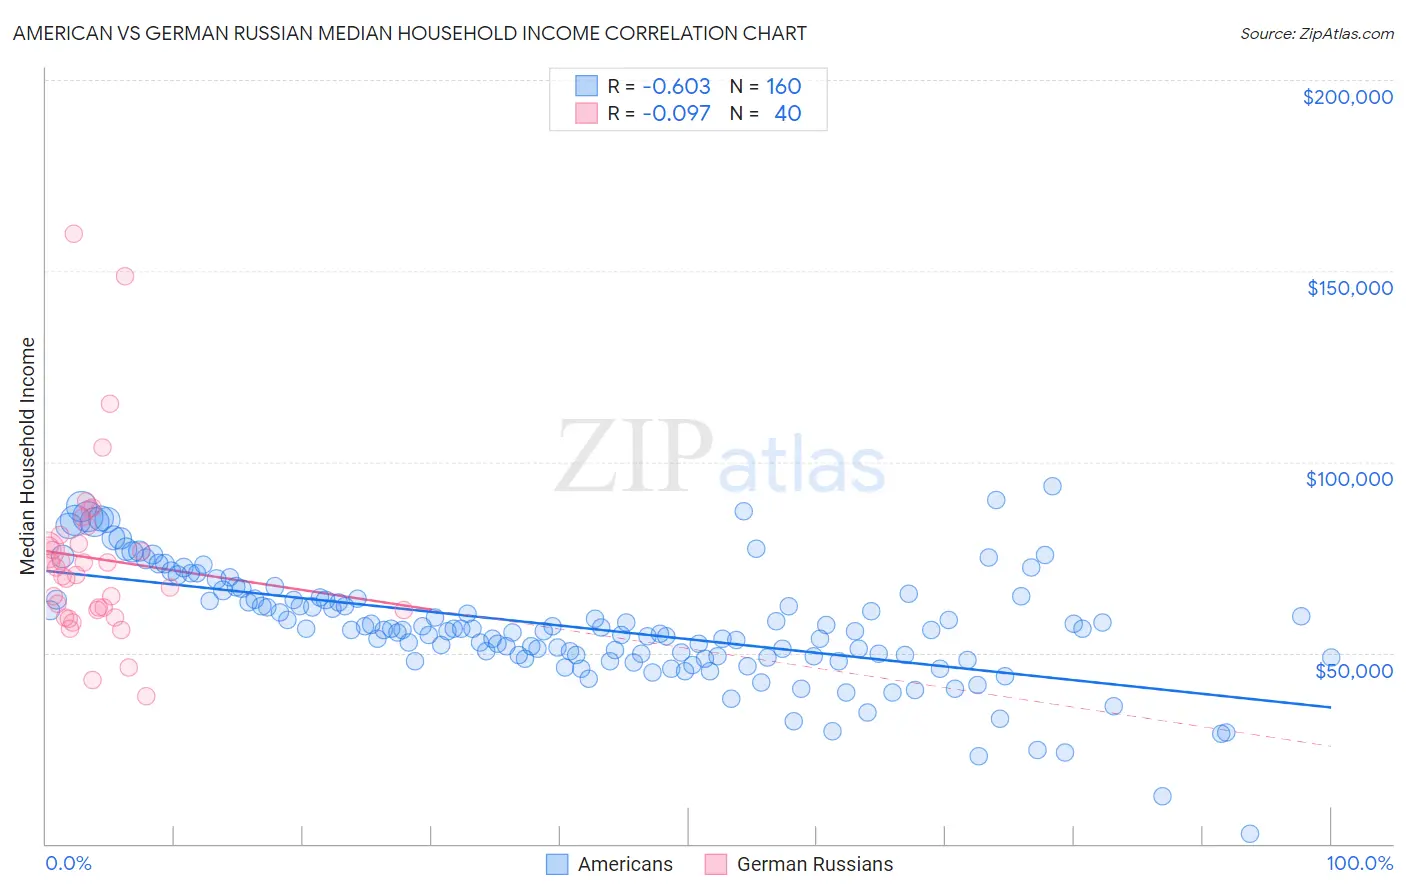
American vs German Russian Median Household Income Correlation Chart
The statistical analysis conducted on geographies consisting of 580,584,472 people shows a significant negative correlation between the proportion of Americans and median household income in the United States with a correlation coefficient (R) of -0.603 and weighted average of $75,932. Similarly, the statistical analysis conducted on geographies consisting of 96,440,966 people shows a slight negative correlation between the proportion of German Russians and median household income in the United States with a correlation coefficient (R) of -0.097 and weighted average of $75,856, a difference of 0.10%.
Median Household Income Correlation Summary
| Measurement | American | German Russian |
| Minimum | $2,499 | $38,750 |
| Maximum | $93,750 | $159,827 |
| Range | $91,251 | $121,077 |
| Mean | $56,747 | $74,697 |
| Median | $56,097 | $71,396 |
| Interquartile 25% (IQ1) | $48,888 | $61,250 |
| Interquartile 75% (IQ3) | $64,069 | $79,678 |
| Interquartile Range (IQR) | $15,181 | $18,428 |
| Standard Deviation (Sample) | $14,812 | $23,757 |
| Standard Deviation (Population) | $14,765 | $23,458 |
Demographics Similar to Americans and German Russians by Median Household Income
In terms of median household income, the demographic groups most similar to Americans are Immigrants from Belize ($75,938, a difference of 0.010%), Guatemalan ($75,961, a difference of 0.040%), Immigrants from Jamaica ($75,851, a difference of 0.11%), Cape Verdean ($75,848, a difference of 0.11%), and Hmong ($75,839, a difference of 0.12%). Similarly, the demographic groups most similar to German Russians are Immigrants from Jamaica ($75,851, a difference of 0.010%), Cape Verdean ($75,848, a difference of 0.010%), Hmong ($75,839, a difference of 0.020%), Pennsylvania German ($75,814, a difference of 0.060%), and Somali ($75,782, a difference of 0.10%).
| Demographics | Rating | Rank | Median Household Income |
| Belizeans | 0.6 /100 | #256 | Tragic $77,028 |
| Immigrants | Senegal | 0.5 /100 | #257 | Tragic $76,915 |
| Immigrants | Nicaragua | 0.5 /100 | #258 | Tragic $76,784 |
| Spanish American Indians | 0.4 /100 | #259 | Tragic $76,670 |
| Jamaicans | 0.4 /100 | #260 | Tragic $76,583 |
| Immigrants | Grenada | 0.4 /100 | #261 | Tragic $76,517 |
| French American Indians | 0.4 /100 | #262 | Tragic $76,387 |
| Alaskan Athabascans | 0.4 /100 | #263 | Tragic $76,383 |
| Guatemalans | 0.3 /100 | #264 | Tragic $75,961 |
| Immigrants | Belize | 0.3 /100 | #265 | Tragic $75,938 |
| Americans | 0.3 /100 | #266 | Tragic $75,932 |
| German Russians | 0.3 /100 | #267 | Tragic $75,856 |
| Immigrants | Jamaica | 0.3 /100 | #268 | Tragic $75,851 |
| Cape Verdeans | 0.3 /100 | #269 | Tragic $75,848 |
| Hmong | 0.3 /100 | #270 | Tragic $75,839 |
| Pennsylvania Germans | 0.3 /100 | #271 | Tragic $75,814 |
| Somalis | 0.3 /100 | #272 | Tragic $75,782 |
| Liberians | 0.2 /100 | #273 | Tragic $75,667 |
| British West Indians | 0.2 /100 | #274 | Tragic $75,647 |
| Immigrants | Micronesia | 0.2 /100 | #275 | Tragic $75,574 |
| Immigrants | Latin America | 0.2 /100 | #276 | Tragic $75,420 |