Luxembourger vs Immigrants from Austria Births to Unmarried Women
COMPARE
Luxembourger
Immigrants from Austria
Births to Unmarried Women
Births to Unmarried Women Comparison
Luxembourgers
Immigrants from Austria
29.4%
BIRTHS TO UNMARRIED WOMEN
95.2/ 100
METRIC RATING
100th/ 347
METRIC RANK
28.7%
BIRTHS TO UNMARRIED WOMEN
98.1/ 100
METRIC RATING
81st/ 347
METRIC RANK
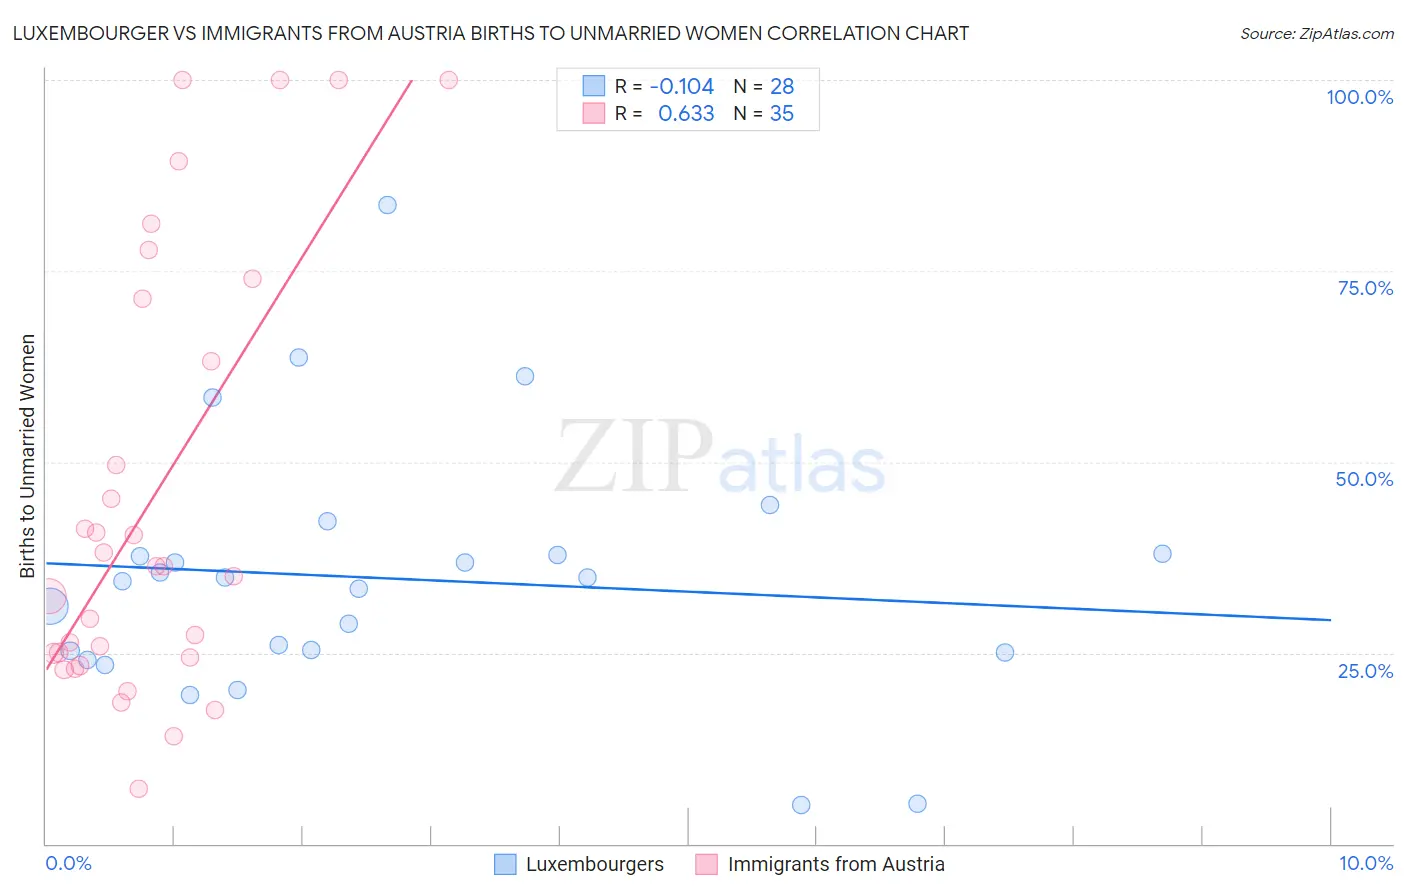
Luxembourger vs Immigrants from Austria Births to Unmarried Women Correlation Chart
The statistical analysis conducted on geographies consisting of 138,038,346 people shows a poor negative correlation between the proportion of Luxembourgers and percentage of births to unmarried women in the United States with a correlation coefficient (R) of -0.104 and weighted average of 29.4%. Similarly, the statistical analysis conducted on geographies consisting of 159,179,999 people shows a significant positive correlation between the proportion of Immigrants from Austria and percentage of births to unmarried women in the United States with a correlation coefficient (R) of 0.633 and weighted average of 28.7%, a difference of 2.5%.
Births to Unmarried Women Correlation Summary
| Measurement | Luxembourger | Immigrants from Austria |
| Minimum | 5.1% | 7.2% |
| Maximum | 83.6% | 100.0% |
| Range | 78.5% | 92.8% |
| Mean | 34.7% | 45.2% |
| Median | 34.6% | 36.4% |
| Interquartile 25% (IQ1) | 25.1% | 24.4% |
| Interquartile 75% (IQ3) | 37.9% | 71.3% |
| Interquartile Range (IQR) | 12.7% | 46.9% |
| Standard Deviation (Sample) | 16.7% | 28.3% |
| Standard Deviation (Population) | 16.4% | 27.9% |
Demographics Similar to Luxembourgers and Immigrants from Austria by Births to Unmarried Women
In terms of births to unmarried women, the demographic groups most similar to Luxembourgers are Immigrants from Denmark (29.4%, a difference of 0.0%), Immigrants from Syria (29.4%, a difference of 0.24%), Immigrants from South Africa (29.3%, a difference of 0.26%), Norwegian (29.3%, a difference of 0.30%), and Immigrants from Vietnam (29.3%, a difference of 0.53%). Similarly, the demographic groups most similar to Immigrants from Austria are Immigrants from Afghanistan (28.7%, a difference of 0.040%), Romanian (28.7%, a difference of 0.11%), Immigrants from Kuwait (28.8%, a difference of 0.18%), Immigrants from Poland (28.9%, a difference of 0.61%), and Sri Lankan (28.9%, a difference of 0.78%).
| Demographics | Rating | Rank | Births to Unmarried Women |
| Immigrants | Afghanistan | 98.1 /100 | #80 | Exceptional 28.7% |
| Immigrants | Austria | 98.1 /100 | #81 | Exceptional 28.7% |
| Romanians | 98.0 /100 | #82 | Exceptional 28.7% |
| Immigrants | Kuwait | 98.0 /100 | #83 | Exceptional 28.8% |
| Immigrants | Poland | 97.6 /100 | #84 | Exceptional 28.9% |
| Sri Lankans | 97.5 /100 | #85 | Exceptional 28.9% |
| Immigrants | Jordan | 97.4 /100 | #86 | Exceptional 29.0% |
| Taiwanese | 97.3 /100 | #87 | Exceptional 29.0% |
| Immigrants | France | 97.3 /100 | #88 | Exceptional 29.0% |
| Immigrants | Saudi Arabia | 97.0 /100 | #89 | Exceptional 29.1% |
| Immigrants | Latvia | 96.8 /100 | #90 | Exceptional 29.1% |
| Immigrants | Fiji | 96.6 /100 | #91 | Exceptional 29.2% |
| Arabs | 96.5 /100 | #92 | Exceptional 29.2% |
| Estonians | 96.5 /100 | #93 | Exceptional 29.2% |
| Ukrainians | 96.3 /100 | #94 | Exceptional 29.2% |
| Immigrants | Vietnam | 96.1 /100 | #95 | Exceptional 29.3% |
| Norwegians | 95.8 /100 | #96 | Exceptional 29.3% |
| Immigrants | South Africa | 95.7 /100 | #97 | Exceptional 29.3% |
| Immigrants | Syria | 95.7 /100 | #98 | Exceptional 29.4% |
| Immigrants | Denmark | 95.3 /100 | #99 | Exceptional 29.4% |
| Luxembourgers | 95.2 /100 | #100 | Exceptional 29.4% |