Yuman vs Serbian Currently Married
COMPARE
Yuman
Serbian
Currently Married
Currently Married Comparison
Yuman
Serbians
42.6%
CURRENTLY MARRIED
0.0/ 100
METRIC RATING
293rd/ 347
METRIC RANK
47.8%
CURRENTLY MARRIED
93.6/ 100
METRIC RATING
104th/ 347
METRIC RANK
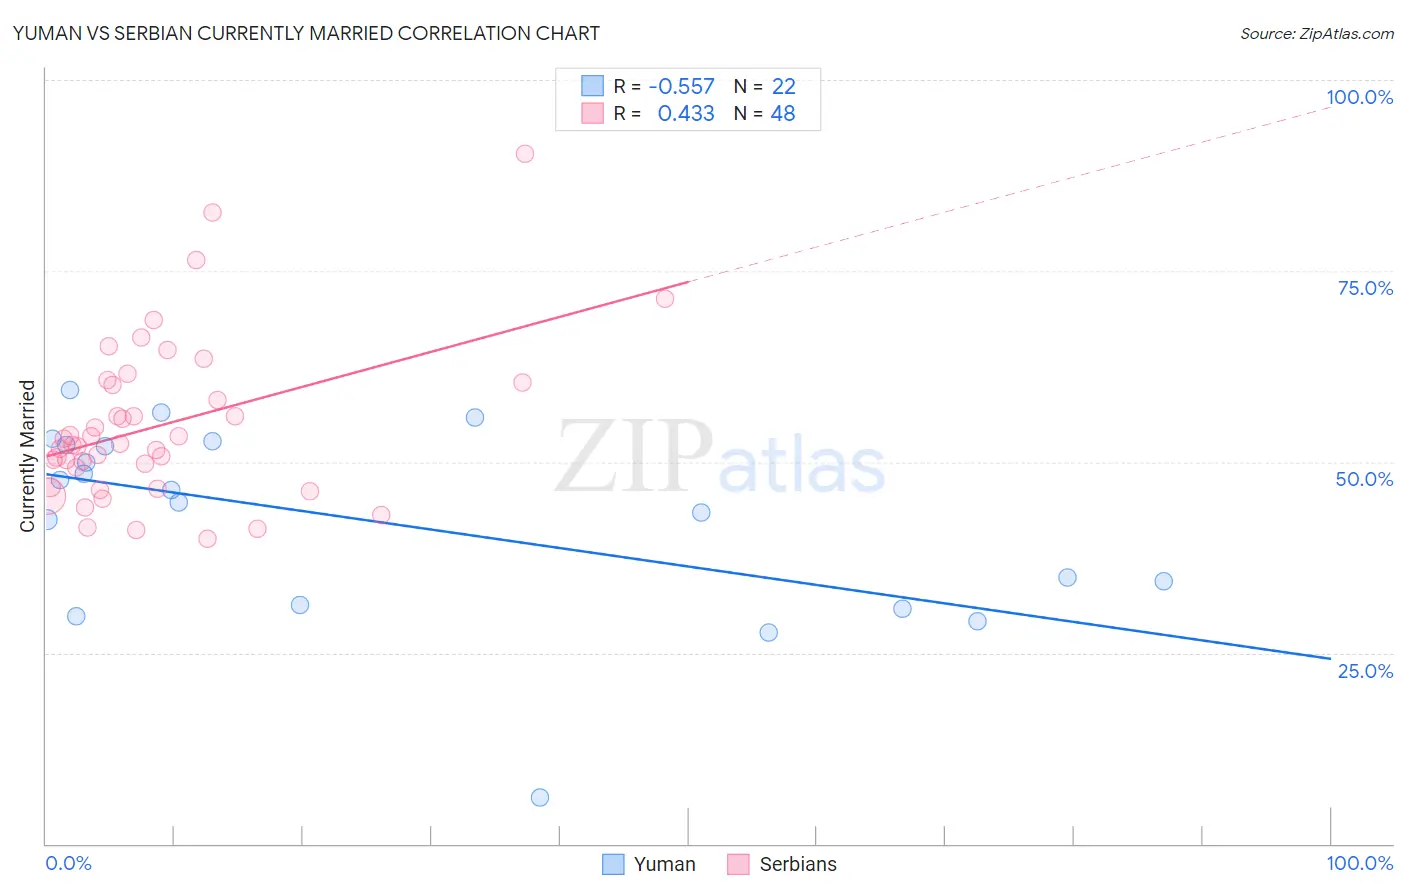
Yuman vs Serbian Currently Married Correlation Chart
The statistical analysis conducted on geographies consisting of 40,696,202 people shows a substantial negative correlation between the proportion of Yuman and percentage of population currently married in the United States with a correlation coefficient (R) of -0.557 and weighted average of 42.6%. Similarly, the statistical analysis conducted on geographies consisting of 267,625,038 people shows a moderate positive correlation between the proportion of Serbians and percentage of population currently married in the United States with a correlation coefficient (R) of 0.433 and weighted average of 47.8%, a difference of 12.2%.
Currently Married Correlation Summary
| Measurement | Yuman | Serbian |
| Minimum | 6.1% | 40.0% |
| Maximum | 59.4% | 90.4% |
| Range | 53.3% | 50.4% |
| Mean | 42.2% | 54.8% |
| Median | 45.5% | 52.3% |
| Interquartile 25% (IQ1) | 31.2% | 47.9% |
| Interquartile 75% (IQ3) | 52.2% | 60.3% |
| Interquartile Range (IQR) | 21.0% | 12.3% |
| Standard Deviation (Sample) | 12.8% | 10.6% |
| Standard Deviation (Population) | 12.5% | 10.4% |
Similar Demographics by Currently Married
Demographics Similar to Yuman by Currently Married
In terms of currently married, the demographic groups most similar to Yuman are Subsaharan African (42.6%, a difference of 0.020%), Honduran (42.5%, a difference of 0.12%), Immigrants from Guatemala (42.6%, a difference of 0.18%), Immigrants from Ghana (42.7%, a difference of 0.29%), and Paiute (42.7%, a difference of 0.30%).
| Demographics | Rating | Rank | Currently Married |
| Ghanaians | 0.0 /100 | #286 | Tragic 42.9% |
| Guatemalans | 0.0 /100 | #287 | Tragic 42.9% |
| Natives/Alaskans | 0.0 /100 | #288 | Tragic 42.8% |
| Paiute | 0.0 /100 | #289 | Tragic 42.7% |
| Immigrants | Ghana | 0.0 /100 | #290 | Tragic 42.7% |
| Immigrants | Guatemala | 0.0 /100 | #291 | Tragic 42.6% |
| Sub-Saharan Africans | 0.0 /100 | #292 | Tragic 42.6% |
| Yuman | 0.0 /100 | #293 | Tragic 42.6% |
| Hondurans | 0.0 /100 | #294 | Tragic 42.5% |
| Immigrants | Western Africa | 0.0 /100 | #295 | Tragic 42.4% |
| Menominee | 0.0 /100 | #296 | Tragic 42.3% |
| Cheyenne | 0.0 /100 | #297 | Tragic 42.2% |
| Immigrants | Honduras | 0.0 /100 | #298 | Tragic 42.2% |
| Liberians | 0.0 /100 | #299 | Tragic 42.2% |
| Belizeans | 0.0 /100 | #300 | Tragic 42.2% |
Demographics Similar to Serbians by Currently Married
In terms of currently married, the demographic groups most similar to Serbians are Cypriot (47.8%, a difference of 0.020%), Turkish (47.8%, a difference of 0.050%), Immigrants from Singapore (47.8%, a difference of 0.050%), Immigrants from Germany (47.8%, a difference of 0.070%), and Celtic (47.8%, a difference of 0.080%).
| Demographics | Rating | Rank | Currently Married |
| Immigrants | Ukraine | 94.8 /100 | #97 | Exceptional 47.9% |
| Immigrants | China | 94.7 /100 | #98 | Exceptional 47.9% |
| Immigrants | Sweden | 94.3 /100 | #99 | Exceptional 47.8% |
| Celtics | 94.2 /100 | #100 | Exceptional 47.8% |
| Immigrants | Germany | 94.1 /100 | #101 | Exceptional 47.8% |
| Turks | 93.9 /100 | #102 | Exceptional 47.8% |
| Cypriots | 93.7 /100 | #103 | Exceptional 47.8% |
| Serbians | 93.6 /100 | #104 | Exceptional 47.8% |
| Immigrants | Singapore | 93.3 /100 | #105 | Exceptional 47.8% |
| Immigrants | Greece | 93.1 /100 | #106 | Exceptional 47.7% |
| Immigrants | Italy | 92.9 /100 | #107 | Exceptional 47.7% |
| Tsimshian | 92.4 /100 | #108 | Exceptional 47.7% |
| Immigrants | Egypt | 92.3 /100 | #109 | Exceptional 47.7% |
| Immigrants | Russia | 92.0 /100 | #110 | Exceptional 47.7% |
| Immigrants | Hungary | 91.2 /100 | #111 | Exceptional 47.6% |