Immigrants from El Salvador vs Immigrants from Romania Currently Married
COMPARE
Immigrants from El Salvador
Immigrants from Romania
Currently Married
Currently Married Comparison
Immigrants from El Salvador
Immigrants from Romania
43.1%
CURRENTLY MARRIED
0.0/ 100
METRIC RATING
284th/ 347
METRIC RANK
48.4%
CURRENTLY MARRIED
98.5/ 100
METRIC RATING
60th/ 347
METRIC RANK
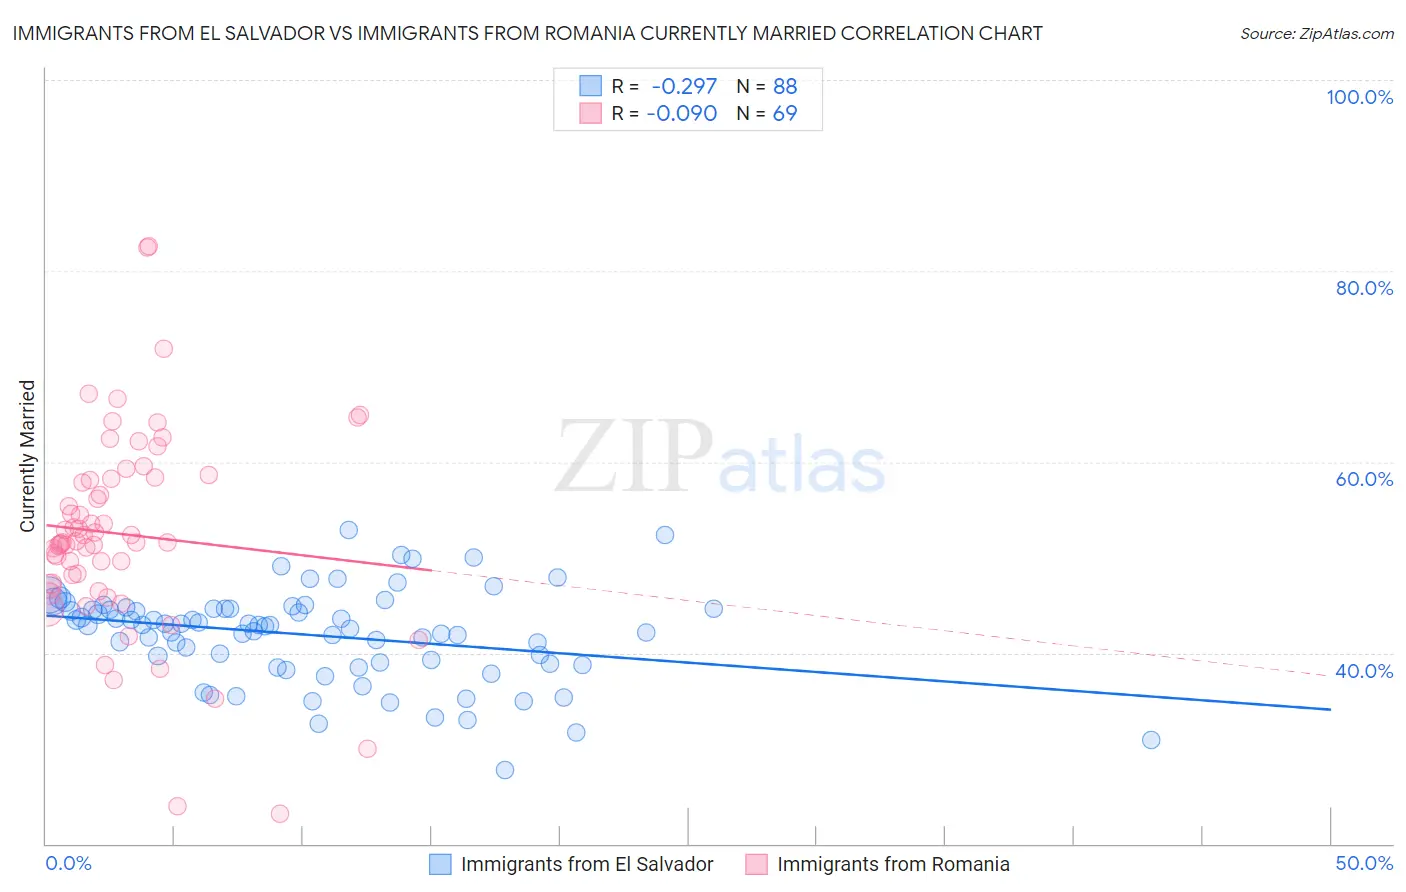
Immigrants from El Salvador vs Immigrants from Romania Currently Married Correlation Chart
The statistical analysis conducted on geographies consisting of 357,815,519 people shows a weak negative correlation between the proportion of Immigrants from El Salvador and percentage of population currently married in the United States with a correlation coefficient (R) of -0.297 and weighted average of 43.1%. Similarly, the statistical analysis conducted on geographies consisting of 257,009,333 people shows a slight negative correlation between the proportion of Immigrants from Romania and percentage of population currently married in the United States with a correlation coefficient (R) of -0.090 and weighted average of 48.4%, a difference of 12.2%.
Currently Married Correlation Summary
| Measurement | Immigrants from El Salvador | Immigrants from Romania |
| Minimum | 27.7% | 23.2% |
| Maximum | 52.9% | 82.6% |
| Range | 25.1% | 59.4% |
| Mean | 41.9% | 52.4% |
| Median | 42.9% | 51.6% |
| Interquartile 25% (IQ1) | 38.9% | 47.1% |
| Interquartile 75% (IQ3) | 44.7% | 58.3% |
| Interquartile Range (IQR) | 5.8% | 11.2% |
| Standard Deviation (Sample) | 4.8% | 10.7% |
| Standard Deviation (Population) | 4.8% | 10.6% |
Similar Demographics by Currently Married
Demographics Similar to Immigrants from El Salvador by Currently Married
In terms of currently married, the demographic groups most similar to Immigrants from El Salvador are Kiowa (43.2%, a difference of 0.010%), Immigrants from Ecuador (43.2%, a difference of 0.12%), Apache (43.2%, a difference of 0.20%), Chippewa (43.2%, a difference of 0.20%), and Central American Indian (43.3%, a difference of 0.28%).
| Demographics | Rating | Rank | Currently Married |
| Immigrants | Nigeria | 0.1 /100 | #277 | Tragic 43.4% |
| Central Americans | 0.0 /100 | #278 | Tragic 43.3% |
| Central American Indians | 0.0 /100 | #279 | Tragic 43.3% |
| Apache | 0.0 /100 | #280 | Tragic 43.2% |
| Chippewa | 0.0 /100 | #281 | Tragic 43.2% |
| Immigrants | Ecuador | 0.0 /100 | #282 | Tragic 43.2% |
| Kiowa | 0.0 /100 | #283 | Tragic 43.2% |
| Immigrants | El Salvador | 0.0 /100 | #284 | Tragic 43.1% |
| Immigrants | Middle Africa | 0.0 /100 | #285 | Tragic 43.0% |
| Ghanaians | 0.0 /100 | #286 | Tragic 42.9% |
| Guatemalans | 0.0 /100 | #287 | Tragic 42.9% |
| Natives/Alaskans | 0.0 /100 | #288 | Tragic 42.8% |
| Paiute | 0.0 /100 | #289 | Tragic 42.7% |
| Immigrants | Ghana | 0.0 /100 | #290 | Tragic 42.7% |
| Immigrants | Guatemala | 0.0 /100 | #291 | Tragic 42.6% |
Demographics Similar to Immigrants from Romania by Currently Married
In terms of currently married, the demographic groups most similar to Immigrants from Romania are Immigrants from Ireland (48.4%, a difference of 0.010%), Romanian (48.4%, a difference of 0.010%), Asian (48.4%, a difference of 0.010%), French (48.4%, a difference of 0.040%), and Immigrants from Netherlands (48.5%, a difference of 0.090%).
| Demographics | Rating | Rank | Currently Married |
| Immigrants | Austria | 98.8 /100 | #53 | Exceptional 48.5% |
| Immigrants | Moldova | 98.7 /100 | #54 | Exceptional 48.5% |
| Immigrants | North Macedonia | 98.7 /100 | #55 | Exceptional 48.5% |
| Latvians | 98.7 /100 | #56 | Exceptional 48.5% |
| Immigrants | Netherlands | 98.6 /100 | #57 | Exceptional 48.5% |
| French | 98.6 /100 | #58 | Exceptional 48.4% |
| Immigrants | Ireland | 98.5 /100 | #59 | Exceptional 48.4% |
| Immigrants | Romania | 98.5 /100 | #60 | Exceptional 48.4% |
| Romanians | 98.5 /100 | #61 | Exceptional 48.4% |
| Asians | 98.5 /100 | #62 | Exceptional 48.4% |
| Slavs | 98.3 /100 | #63 | Exceptional 48.4% |
| Immigrants | Czechoslovakia | 98.3 /100 | #64 | Exceptional 48.4% |
| Ukrainians | 98.3 /100 | #65 | Exceptional 48.4% |
| Tongans | 98.2 /100 | #66 | Exceptional 48.3% |
| Slovaks | 98.2 /100 | #67 | Exceptional 48.3% |