Yuman vs British West Indian Currently Married
COMPARE
Yuman
British West Indian
Currently Married
Currently Married Comparison
Yuman
British West Indians
42.6%
CURRENTLY MARRIED
0.0/ 100
METRIC RATING
293rd/ 347
METRIC RANK
39.8%
CURRENTLY MARRIED
0.0/ 100
METRIC RATING
336th/ 347
METRIC RANK
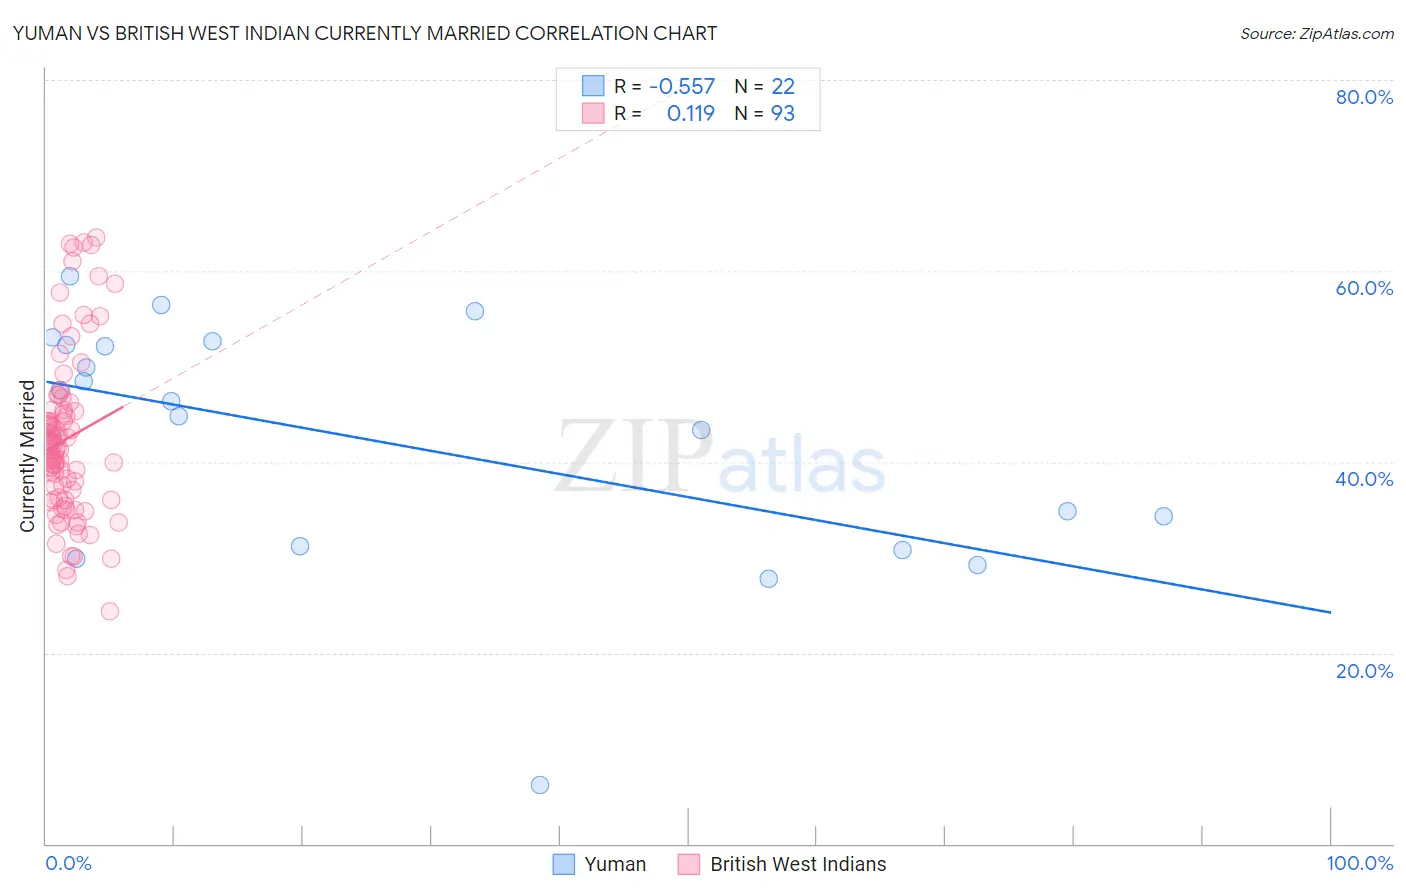
Yuman vs British West Indian Currently Married Correlation Chart
The statistical analysis conducted on geographies consisting of 40,696,202 people shows a substantial negative correlation between the proportion of Yuman and percentage of population currently married in the United States with a correlation coefficient (R) of -0.557 and weighted average of 42.6%. Similarly, the statistical analysis conducted on geographies consisting of 152,687,142 people shows a poor positive correlation between the proportion of British West Indians and percentage of population currently married in the United States with a correlation coefficient (R) of 0.119 and weighted average of 39.8%, a difference of 7.1%.
Currently Married Correlation Summary
| Measurement | Yuman | British West Indian |
| Minimum | 6.1% | 24.4% |
| Maximum | 59.4% | 63.5% |
| Range | 53.3% | 39.1% |
| Mean | 42.2% | 42.4% |
| Median | 45.5% | 41.4% |
| Interquartile 25% (IQ1) | 31.2% | 36.0% |
| Interquartile 75% (IQ3) | 52.2% | 45.4% |
| Interquartile Range (IQR) | 21.0% | 9.4% |
| Standard Deviation (Sample) | 12.8% | 8.7% |
| Standard Deviation (Population) | 12.5% | 8.7% |
Similar Demographics by Currently Married
Demographics Similar to Yuman by Currently Married
In terms of currently married, the demographic groups most similar to Yuman are Subsaharan African (42.6%, a difference of 0.020%), Honduran (42.5%, a difference of 0.12%), Immigrants from Guatemala (42.6%, a difference of 0.18%), Immigrants from Ghana (42.7%, a difference of 0.29%), and Paiute (42.7%, a difference of 0.30%).
| Demographics | Rating | Rank | Currently Married |
| Ghanaians | 0.0 /100 | #286 | Tragic 42.9% |
| Guatemalans | 0.0 /100 | #287 | Tragic 42.9% |
| Natives/Alaskans | 0.0 /100 | #288 | Tragic 42.8% |
| Paiute | 0.0 /100 | #289 | Tragic 42.7% |
| Immigrants | Ghana | 0.0 /100 | #290 | Tragic 42.7% |
| Immigrants | Guatemala | 0.0 /100 | #291 | Tragic 42.6% |
| Sub-Saharan Africans | 0.0 /100 | #292 | Tragic 42.6% |
| Yuman | 0.0 /100 | #293 | Tragic 42.6% |
| Hondurans | 0.0 /100 | #294 | Tragic 42.5% |
| Immigrants | Western Africa | 0.0 /100 | #295 | Tragic 42.4% |
| Menominee | 0.0 /100 | #296 | Tragic 42.3% |
| Cheyenne | 0.0 /100 | #297 | Tragic 42.2% |
| Immigrants | Honduras | 0.0 /100 | #298 | Tragic 42.2% |
| Liberians | 0.0 /100 | #299 | Tragic 42.2% |
| Belizeans | 0.0 /100 | #300 | Tragic 42.2% |
Demographics Similar to British West Indians by Currently Married
In terms of currently married, the demographic groups most similar to British West Indians are Lumbee (39.8%, a difference of 0.18%), Puerto Rican (39.9%, a difference of 0.34%), Yup'ik (39.9%, a difference of 0.35%), Black/African American (39.6%, a difference of 0.38%), and Cape Verdean (39.6%, a difference of 0.47%).
| Demographics | Rating | Rank | Currently Married |
| Crow | 0.0 /100 | #329 | Tragic 40.4% |
| Immigrants | Dominica | 0.0 /100 | #330 | Tragic 40.3% |
| Immigrants | Barbados | 0.0 /100 | #331 | Tragic 40.3% |
| Immigrants | St. Vincent and the Grenadines | 0.0 /100 | #332 | Tragic 40.1% |
| Yup'ik | 0.0 /100 | #333 | Tragic 39.9% |
| Puerto Ricans | 0.0 /100 | #334 | Tragic 39.9% |
| Lumbee | 0.0 /100 | #335 | Tragic 39.8% |
| British West Indians | 0.0 /100 | #336 | Tragic 39.8% |
| Blacks/African Americans | 0.0 /100 | #337 | Tragic 39.6% |
| Cape Verdeans | 0.0 /100 | #338 | Tragic 39.6% |
| Dominicans | 0.0 /100 | #339 | Tragic 39.5% |
| Immigrants | Grenada | 0.0 /100 | #340 | Tragic 39.1% |
| Navajo | 0.0 /100 | #341 | Tragic 39.0% |
| Immigrants | Dominican Republic | 0.0 /100 | #342 | Tragic 38.9% |
| Pueblo | 0.0 /100 | #343 | Tragic 38.2% |