Inupiat vs Immigrants from Belgium Married-couple Households
COMPARE
Inupiat
Immigrants from Belgium
Married-couple Households
Married-couple Households Comparison
Inupiat
Immigrants from Belgium
42.4%
MARRIED-COUPLE HOUSEHOLDS
0.0/ 100
METRIC RATING
283rd/ 347
METRIC RANK
47.9%
MARRIED-COUPLE HOUSEHOLDS
96.8/ 100
METRIC RATING
95th/ 347
METRIC RANK
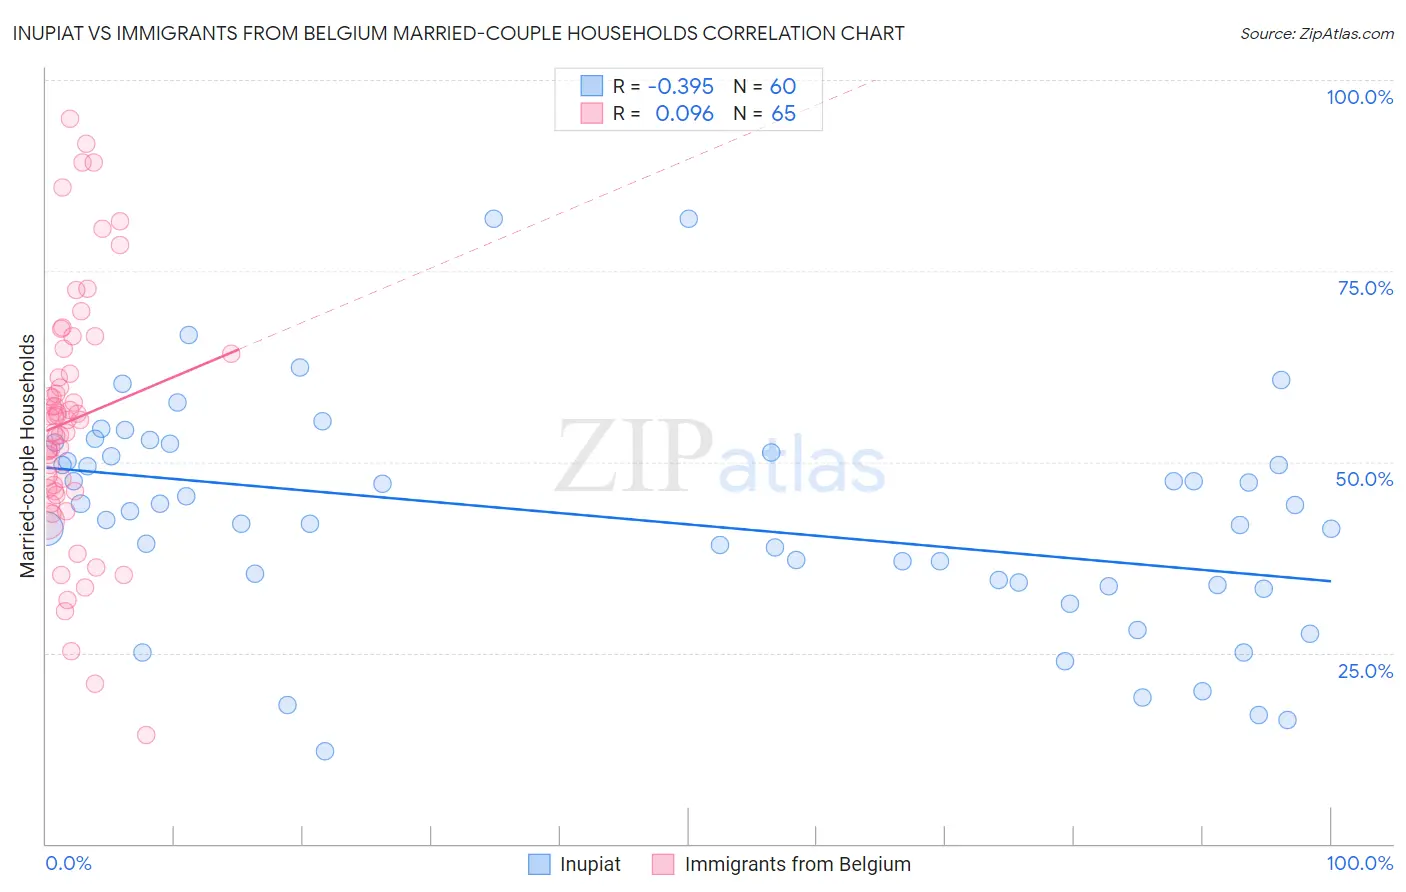
Inupiat vs Immigrants from Belgium Married-couple Households Correlation Chart
The statistical analysis conducted on geographies consisting of 96,320,700 people shows a mild negative correlation between the proportion of Inupiat and percentage of married-couple family households in the United States with a correlation coefficient (R) of -0.395 and weighted average of 42.4%. Similarly, the statistical analysis conducted on geographies consisting of 146,698,570 people shows a slight positive correlation between the proportion of Immigrants from Belgium and percentage of married-couple family households in the United States with a correlation coefficient (R) of 0.096 and weighted average of 47.9%, a difference of 13.0%.
Married-couple Households Correlation Summary
| Measurement | Inupiat | Immigrants from Belgium |
| Minimum | 12.1% | 14.3% |
| Maximum | 81.8% | 94.9% |
| Range | 69.7% | 80.6% |
| Mean | 42.6% | 55.5% |
| Median | 43.0% | 55.5% |
| Interquartile 25% (IQ1) | 34.1% | 46.1% |
| Interquartile 75% (IQ3) | 51.0% | 64.5% |
| Interquartile Range (IQR) | 16.9% | 18.4% |
| Standard Deviation (Sample) | 14.4% | 16.6% |
| Standard Deviation (Population) | 14.3% | 16.5% |
Similar Demographics by Married-couple Households
Demographics Similar to Inupiat by Married-couple Households
In terms of married-couple households, the demographic groups most similar to Inupiat are Bermudan (42.4%, a difference of 0.10%), Cheyenne (42.3%, a difference of 0.36%), Ghanaian (42.2%, a difference of 0.39%), Belizean (42.2%, a difference of 0.39%), and Chippewa (42.1%, a difference of 0.63%).
| Demographics | Rating | Rank | Married-couple Households |
| Immigrants | Ethiopia | 0.0 /100 | #276 | Tragic 43.1% |
| Immigrants | Eastern Africa | 0.0 /100 | #277 | Tragic 42.9% |
| Immigrants | Africa | 0.0 /100 | #278 | Tragic 42.9% |
| Sierra Leoneans | 0.0 /100 | #279 | Tragic 42.9% |
| Immigrants | Ecuador | 0.0 /100 | #280 | Tragic 42.9% |
| Immigrants | Guatemala | 0.0 /100 | #281 | Tragic 42.8% |
| Bermudans | 0.0 /100 | #282 | Tragic 42.4% |
| Inupiat | 0.0 /100 | #283 | Tragic 42.4% |
| Cheyenne | 0.0 /100 | #284 | Tragic 42.3% |
| Ghanaians | 0.0 /100 | #285 | Tragic 42.2% |
| Belizeans | 0.0 /100 | #286 | Tragic 42.2% |
| Chippewa | 0.0 /100 | #287 | Tragic 42.1% |
| Immigrants | Eritrea | 0.0 /100 | #288 | Tragic 42.1% |
| Sudanese | 0.0 /100 | #289 | Tragic 42.1% |
| Hondurans | 0.0 /100 | #290 | Tragic 42.1% |
Demographics Similar to Immigrants from Belgium by Married-couple Households
In terms of married-couple households, the demographic groups most similar to Immigrants from Belgium are American (47.9%, a difference of 0.030%), Lebanese (47.9%, a difference of 0.040%), Immigrants from Egypt (47.9%, a difference of 0.050%), Palestinian (48.0%, a difference of 0.060%), and Immigrants from Moldova (48.0%, a difference of 0.070%).
| Demographics | Rating | Rank | Married-couple Households |
| Afghans | 97.3 /100 | #88 | Exceptional 48.0% |
| Cypriots | 97.2 /100 | #89 | Exceptional 48.0% |
| French | 97.2 /100 | #90 | Exceptional 48.0% |
| Immigrants | Moldova | 97.0 /100 | #91 | Exceptional 48.0% |
| Palestinians | 96.9 /100 | #92 | Exceptional 48.0% |
| Lebanese | 96.9 /100 | #93 | Exceptional 47.9% |
| Americans | 96.9 /100 | #94 | Exceptional 47.9% |
| Immigrants | Belgium | 96.8 /100 | #95 | Exceptional 47.9% |
| Immigrants | Egypt | 96.6 /100 | #96 | Exceptional 47.9% |
| Latvians | 96.5 /100 | #97 | Exceptional 47.9% |
| Immigrants | North Macedonia | 96.4 /100 | #98 | Exceptional 47.9% |
| Immigrants | Austria | 96.4 /100 | #99 | Exceptional 47.9% |
| Immigrants | Italy | 96.3 /100 | #100 | Exceptional 47.9% |
| Turks | 96.1 /100 | #101 | Exceptional 47.8% |
| Slavs | 96.0 /100 | #102 | Exceptional 47.8% |