Yugoslavian vs Immigrants from Portugal Family Households
COMPARE
Yugoslavian
Immigrants from Portugal
Family Households
Family Households Comparison
Yugoslavians
Immigrants from Portugal
63.1%
FAMILY HOUSEHOLDS
0.4/ 100
METRIC RATING
269th/ 347
METRIC RANK
65.2%
FAMILY HOUSEHOLDS
98.6/ 100
METRIC RATING
95th/ 347
METRIC RANK
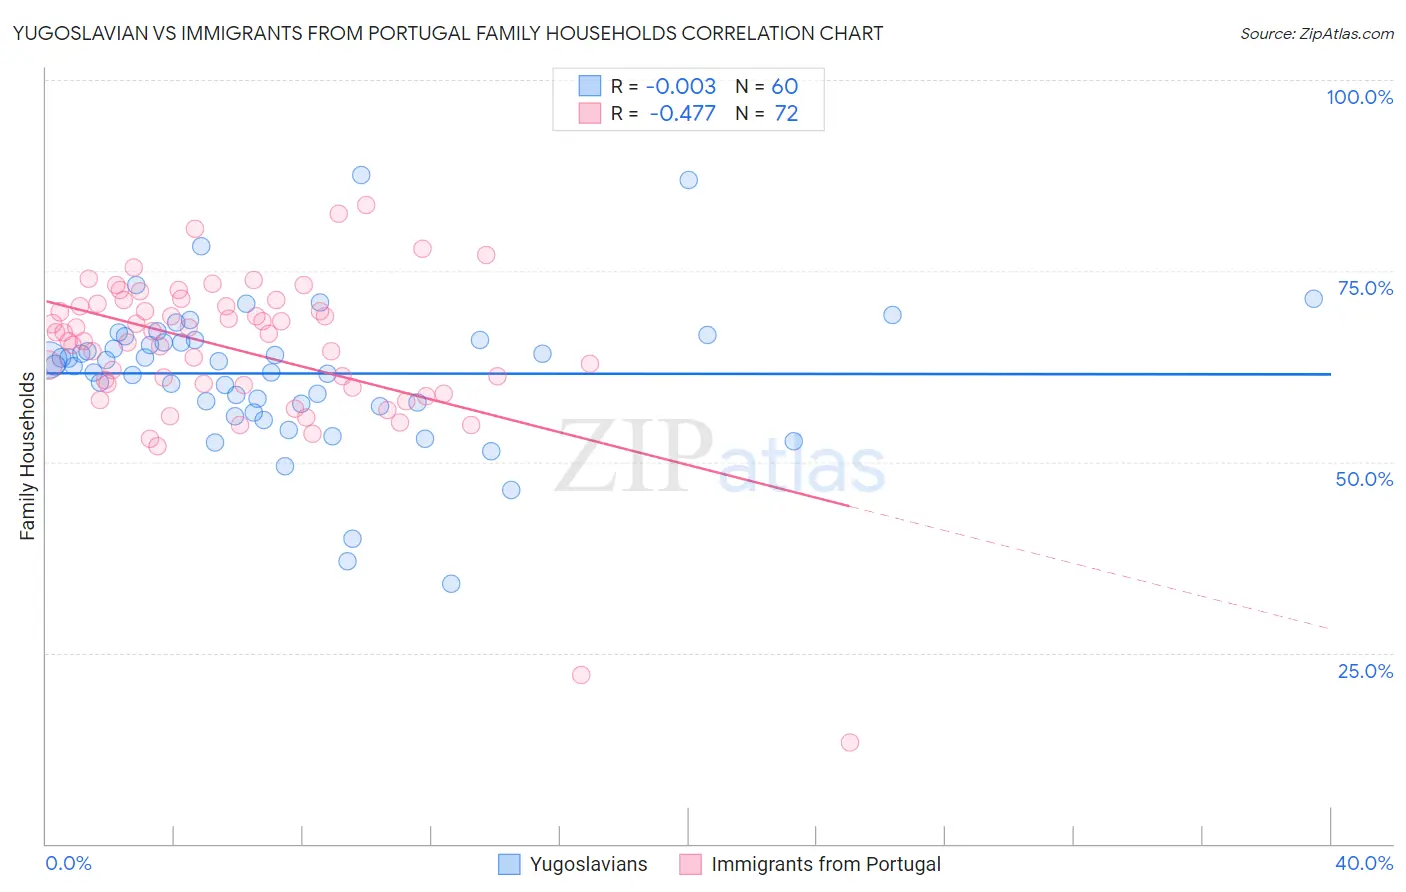
Yugoslavian vs Immigrants from Portugal Family Households Correlation Chart
The statistical analysis conducted on geographies consisting of 285,640,029 people shows no correlation between the proportion of Yugoslavians and percentage of family households in the United States with a correlation coefficient (R) of -0.003 and weighted average of 63.1%. Similarly, the statistical analysis conducted on geographies consisting of 174,766,633 people shows a moderate negative correlation between the proportion of Immigrants from Portugal and percentage of family households in the United States with a correlation coefficient (R) of -0.477 and weighted average of 65.2%, a difference of 3.4%.
Family Households Correlation Summary
| Measurement | Yugoslavian | Immigrants from Portugal |
| Minimum | 34.1% | 13.2% |
| Maximum | 87.5% | 83.6% |
| Range | 53.4% | 70.4% |
| Mean | 61.6% | 64.7% |
| Median | 62.9% | 66.8% |
| Interquartile 25% (IQ1) | 57.5% | 60.1% |
| Interquartile 75% (IQ3) | 65.9% | 70.5% |
| Interquartile Range (IQR) | 8.5% | 10.4% |
| Standard Deviation (Sample) | 9.4% | 10.7% |
| Standard Deviation (Population) | 9.4% | 10.6% |
Similar Demographics by Family Households
Demographics Similar to Yugoslavians by Family Households
In terms of family households, the demographic groups most similar to Yugoslavians are Immigrants from Singapore (63.1%, a difference of 0.0%), Immigrants from Austria (63.1%, a difference of 0.020%), Immigrants from Croatia (63.1%, a difference of 0.030%), Immigrants from Turkey (63.1%, a difference of 0.030%), and Immigrants from Kazakhstan (63.1%, a difference of 0.040%).
| Demographics | Rating | Rank | Family Households |
| Immigrants | Ireland | 0.6 /100 | #262 | Tragic 63.2% |
| Cheyenne | 0.5 /100 | #263 | Tragic 63.2% |
| Kenyans | 0.5 /100 | #264 | Tragic 63.2% |
| Colville | 0.5 /100 | #265 | Tragic 63.2% |
| Immigrants | Western Africa | 0.5 /100 | #266 | Tragic 63.1% |
| Israelis | 0.4 /100 | #267 | Tragic 63.1% |
| Immigrants | Singapore | 0.4 /100 | #268 | Tragic 63.1% |
| Yugoslavians | 0.4 /100 | #269 | Tragic 63.1% |
| Immigrants | Austria | 0.3 /100 | #270 | Tragic 63.1% |
| Immigrants | Croatia | 0.3 /100 | #271 | Tragic 63.1% |
| Immigrants | Turkey | 0.3 /100 | #272 | Tragic 63.1% |
| Immigrants | Kazakhstan | 0.3 /100 | #273 | Tragic 63.1% |
| Lumbee | 0.3 /100 | #274 | Tragic 63.1% |
| West Indians | 0.3 /100 | #275 | Tragic 63.1% |
| Serbians | 0.3 /100 | #276 | Tragic 63.0% |
Demographics Similar to Immigrants from Portugal by Family Households
In terms of family households, the demographic groups most similar to Immigrants from Portugal are Swiss (65.2%, a difference of 0.010%), Guatemalan (65.2%, a difference of 0.010%), Immigrants from Poland (65.2%, a difference of 0.030%), Guyanese (65.3%, a difference of 0.040%), and Hopi (65.3%, a difference of 0.050%).
| Demographics | Rating | Rank | Family Households |
| Immigrants | Haiti | 99.1 /100 | #88 | Exceptional 65.3% |
| Immigrants | Caribbean | 99.1 /100 | #89 | Exceptional 65.3% |
| Immigrants | Laos | 99.1 /100 | #90 | Exceptional 65.3% |
| Crow | 98.9 /100 | #91 | Exceptional 65.3% |
| Hopi | 98.8 /100 | #92 | Exceptional 65.3% |
| Guyanese | 98.8 /100 | #93 | Exceptional 65.3% |
| Immigrants | Poland | 98.7 /100 | #94 | Exceptional 65.2% |
| Immigrants | Portugal | 98.6 /100 | #95 | Exceptional 65.2% |
| Swiss | 98.6 /100 | #96 | Exceptional 65.2% |
| Guatemalans | 98.6 /100 | #97 | Exceptional 65.2% |
| Immigrants | Syria | 98.4 /100 | #98 | Exceptional 65.2% |
| Central American Indians | 98.3 /100 | #99 | Exceptional 65.2% |
| Haitians | 98.1 /100 | #100 | Exceptional 65.2% |
| Chileans | 98.1 /100 | #101 | Exceptional 65.2% |
| Immigrants | Sri Lanka | 98.0 /100 | #102 | Exceptional 65.1% |