Yugoslavian vs Immigrants from South Africa Family Households
COMPARE
Yugoslavian
Immigrants from South Africa
Family Households
Family Households Comparison
Yugoslavians
Immigrants from South Africa
63.1%
FAMILY HOUSEHOLDS
0.4/ 100
METRIC RATING
269th/ 347
METRIC RANK
63.7%
FAMILY HOUSEHOLDS
5.9/ 100
METRIC RATING
221st/ 347
METRIC RANK
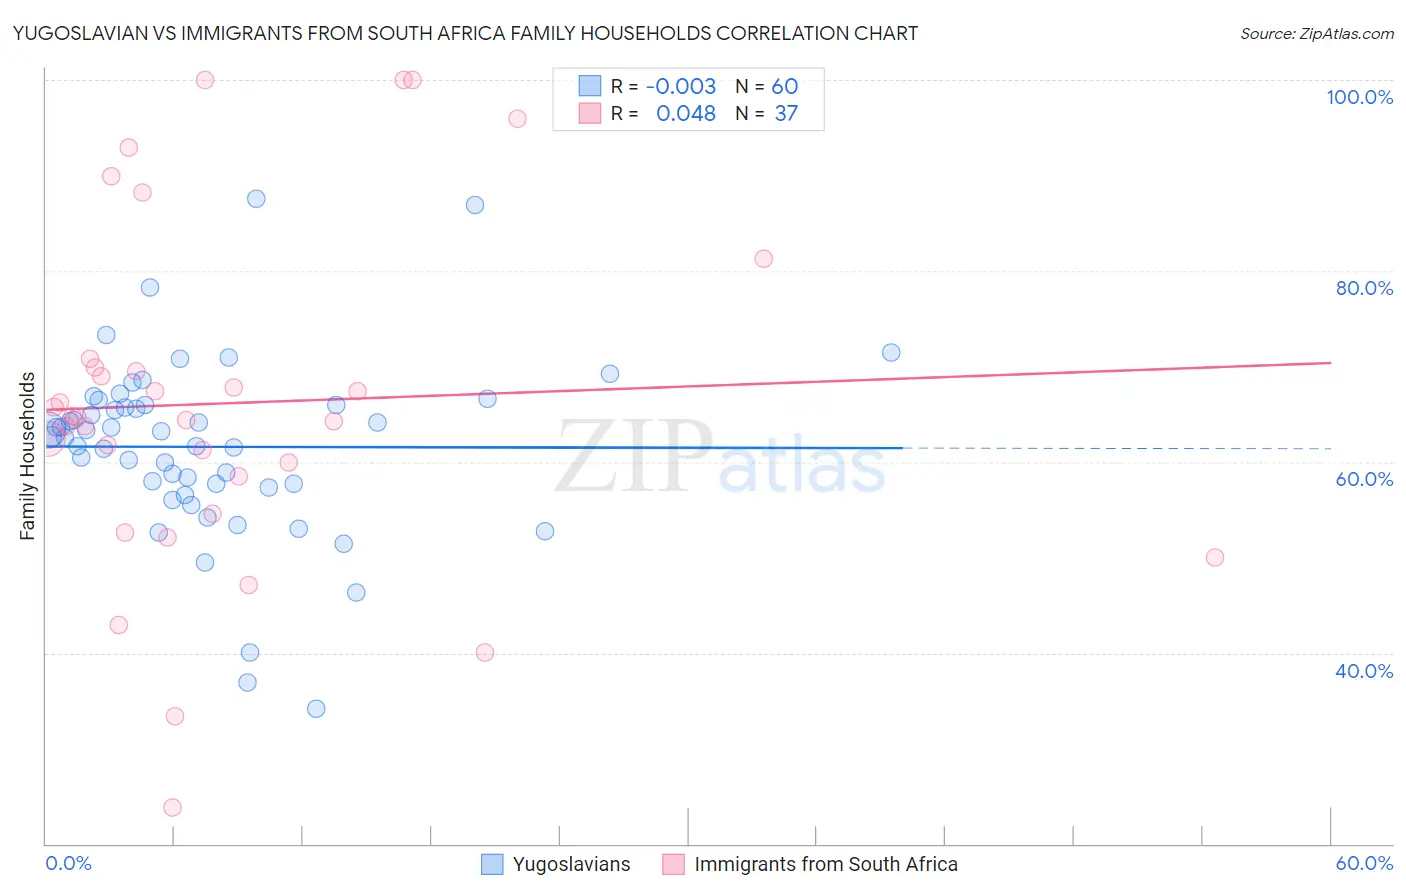
Yugoslavian vs Immigrants from South Africa Family Households Correlation Chart
The statistical analysis conducted on geographies consisting of 285,640,029 people shows no correlation between the proportion of Yugoslavians and percentage of family households in the United States with a correlation coefficient (R) of -0.003 and weighted average of 63.1%. Similarly, the statistical analysis conducted on geographies consisting of 233,270,946 people shows no correlation between the proportion of Immigrants from South Africa and percentage of family households in the United States with a correlation coefficient (R) of 0.048 and weighted average of 63.7%, a difference of 0.98%.
Family Households Correlation Summary
| Measurement | Yugoslavian | Immigrants from South Africa |
| Minimum | 34.1% | 23.8% |
| Maximum | 87.5% | 100.0% |
| Range | 53.4% | 76.2% |
| Mean | 61.6% | 66.2% |
| Median | 62.9% | 64.6% |
| Interquartile 25% (IQ1) | 57.5% | 56.5% |
| Interquartile 75% (IQ3) | 65.9% | 70.3% |
| Interquartile Range (IQR) | 8.5% | 13.8% |
| Standard Deviation (Sample) | 9.4% | 18.1% |
| Standard Deviation (Population) | 9.4% | 17.9% |
Similar Demographics by Family Households
Demographics Similar to Yugoslavians by Family Households
In terms of family households, the demographic groups most similar to Yugoslavians are Immigrants from Singapore (63.1%, a difference of 0.0%), Immigrants from Austria (63.1%, a difference of 0.020%), Immigrants from Croatia (63.1%, a difference of 0.030%), Immigrants from Turkey (63.1%, a difference of 0.030%), and Immigrants from Kazakhstan (63.1%, a difference of 0.040%).
| Demographics | Rating | Rank | Family Households |
| Immigrants | Ireland | 0.6 /100 | #262 | Tragic 63.2% |
| Cheyenne | 0.5 /100 | #263 | Tragic 63.2% |
| Kenyans | 0.5 /100 | #264 | Tragic 63.2% |
| Colville | 0.5 /100 | #265 | Tragic 63.2% |
| Immigrants | Western Africa | 0.5 /100 | #266 | Tragic 63.1% |
| Israelis | 0.4 /100 | #267 | Tragic 63.1% |
| Immigrants | Singapore | 0.4 /100 | #268 | Tragic 63.1% |
| Yugoslavians | 0.4 /100 | #269 | Tragic 63.1% |
| Immigrants | Austria | 0.3 /100 | #270 | Tragic 63.1% |
| Immigrants | Croatia | 0.3 /100 | #271 | Tragic 63.1% |
| Immigrants | Turkey | 0.3 /100 | #272 | Tragic 63.1% |
| Immigrants | Kazakhstan | 0.3 /100 | #273 | Tragic 63.1% |
| Lumbee | 0.3 /100 | #274 | Tragic 63.1% |
| West Indians | 0.3 /100 | #275 | Tragic 63.1% |
| Serbians | 0.3 /100 | #276 | Tragic 63.0% |
Demographics Similar to Immigrants from South Africa by Family Households
In terms of family households, the demographic groups most similar to Immigrants from South Africa are Immigrants from Europe (63.7%, a difference of 0.020%), Macedonian (63.7%, a difference of 0.030%), Immigrants from Belarus (63.7%, a difference of 0.030%), French Canadian (63.7%, a difference of 0.040%), and Osage (63.7%, a difference of 0.060%).
| Demographics | Rating | Rank | Family Households |
| Celtics | 8.0 /100 | #214 | Tragic 63.8% |
| Belgians | 7.6 /100 | #215 | Tragic 63.8% |
| Croatians | 7.3 /100 | #216 | Tragic 63.8% |
| Osage | 7.0 /100 | #217 | Tragic 63.7% |
| Marshallese | 6.9 /100 | #218 | Tragic 63.7% |
| Macedonians | 6.5 /100 | #219 | Tragic 63.7% |
| Immigrants | Europe | 6.4 /100 | #220 | Tragic 63.7% |
| Immigrants | South Africa | 5.9 /100 | #221 | Tragic 63.7% |
| Immigrants | Belarus | 5.5 /100 | #222 | Tragic 63.7% |
| French Canadians | 5.4 /100 | #223 | Tragic 63.7% |
| Turks | 4.5 /100 | #224 | Tragic 63.6% |
| Immigrants | Hungary | 4.3 /100 | #225 | Tragic 63.6% |
| Immigrants | Bahamas | 4.2 /100 | #226 | Tragic 63.6% |
| Trinidadians and Tobagonians | 4.1 /100 | #227 | Tragic 63.6% |
| Blackfeet | 3.6 /100 | #228 | Tragic 63.6% |